 ▲ Bullish
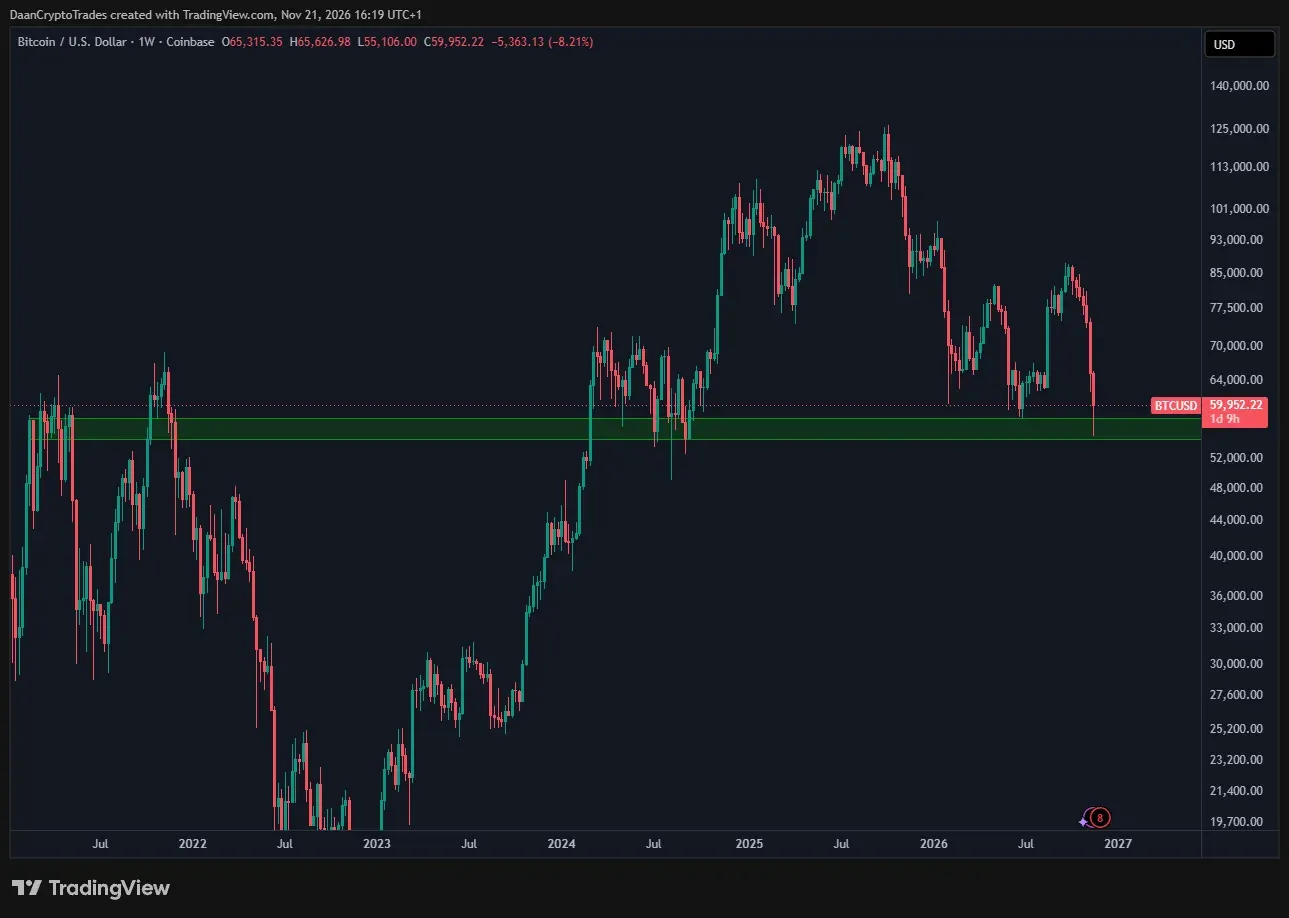
$BTC Powrót do poziomu, który widzieliśmy już wiele razy.
- Szczyt w 2021 roku podczas pierwszego dużego rally
- Drugi szczyt w 2021 roku przed rynkiem niedźwiedzim
- Trzymał się jako wsparcie w 2024 przed kontynuacją rynku byczego
- Utrzymał się przy początkowym teście latem 2026, wywołując duży ruch
- Oto jesteśmy znowu.
Ten region $50K‑$60K od lat jest kluczowy dla ceny Bitcoina. Nie muszę ci mówić, jak ważne jest, by kupujący wchodzili w tym obszarze. Najniższy poziom w lecie 2024 roku w carry trade jena wynosił $49K i wtedy miał miejsce duży czarny łabędź. Moim zdaniem byłby to słaby sygnał, gdyby cena zaczęła znowu spadać w dół.
 ▲ Bullish
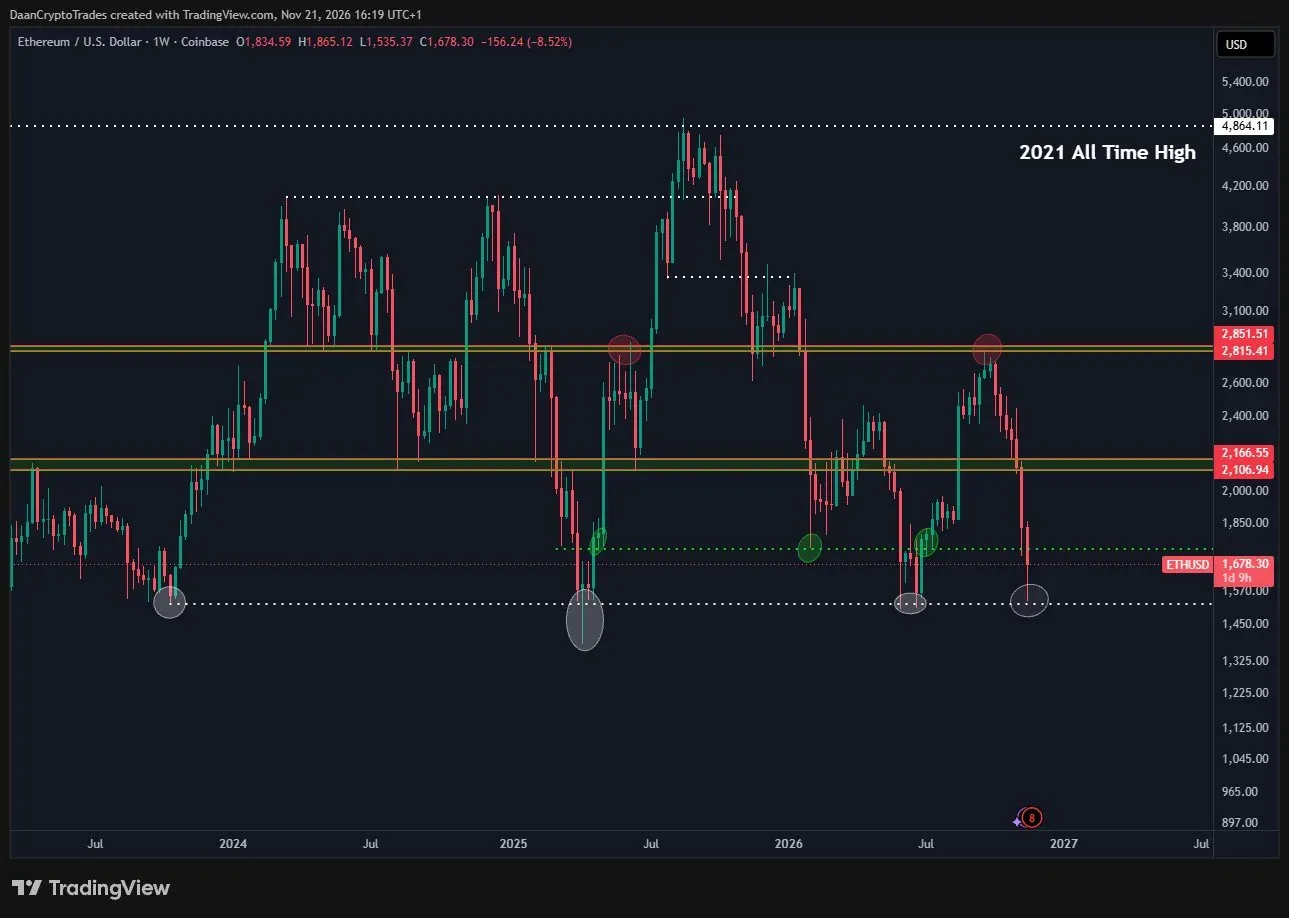
$ETH wraca do dużego poziomu wsparcia, który był testowany wielokrotnie w ciągu ostatnich 3 lat.
- Październik 2023 przed dużym rajdem
- Kwiecień 2025 po krachu taryfy tuż przed tym, jak Tom Lee i Bitmine podbili go do $5K
- Lato 2026 przed dużym odbiciem
- Oto jesteśmy
To kluczowy obszar i chciałbym, aby byki bronily go za wszelką cenę. Następne wsparcie to niski poziom taryfy około $1350. Powyżej $1750 zazwyczaj jest poziomem, przy którym, jeśli cena się utrzyma, następuje większy ruch w górę.
 ▼ Bearish
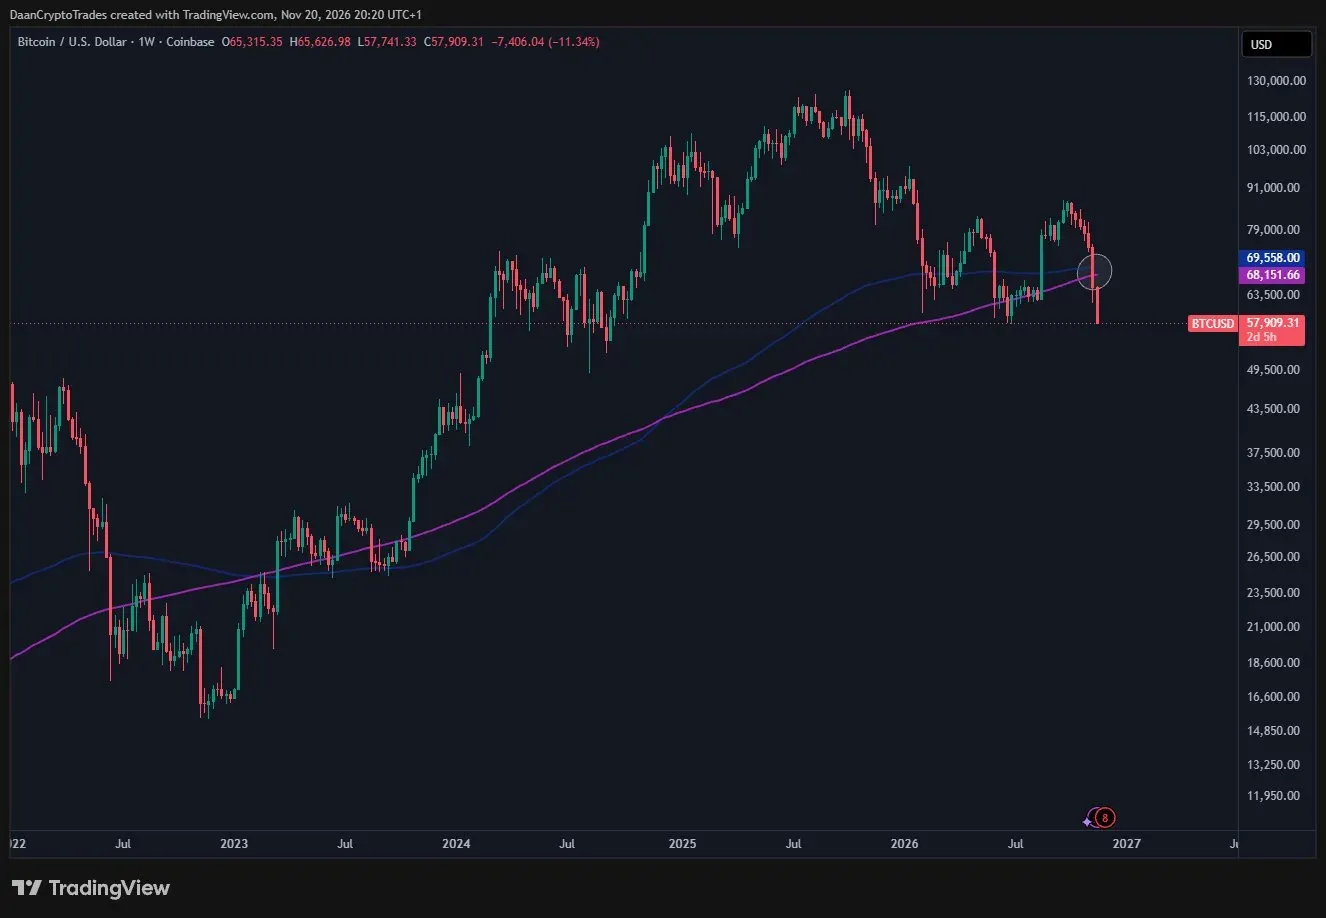
$BTC Tends to see a retest of its Weekly 200MA/EMA after breaking away from it.
But with last week's close it has lost these and bulls aren't making a good effort to retake it this week either.
The weekly 200MA is generally considered solid value for high timeframe spot buys but you can see last bear cycle price did lose it for about ~7 months before finally retaking it again.
 ▼ Bearish
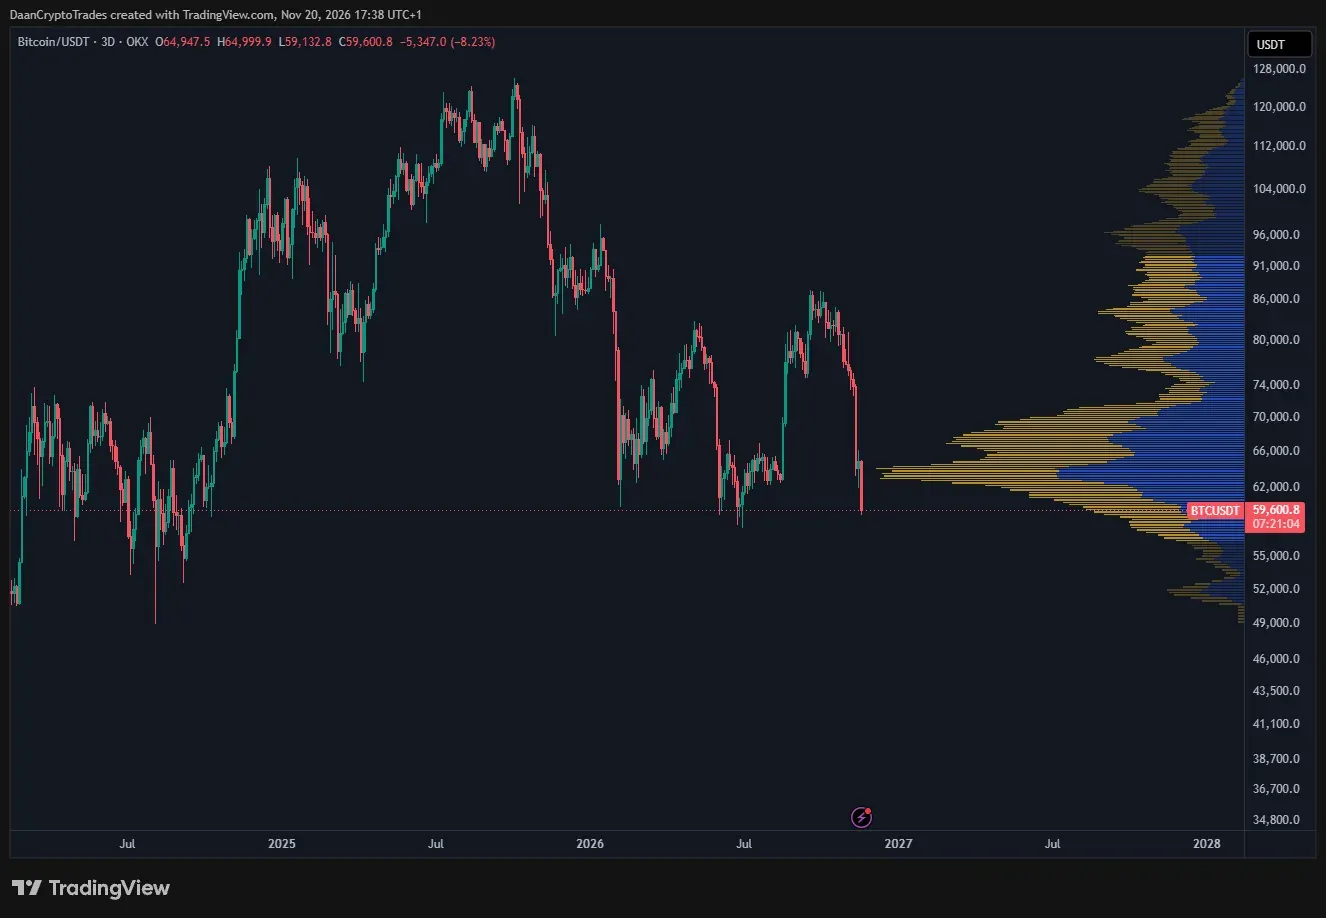
$BTC Trading back below the high volume node from the 2024-2026 years.
Price has spend a big amount of time around that area. That would be the first area of interest for the bulls to retake again when this eventually bounces.
But so far the bears have been in control heavily.
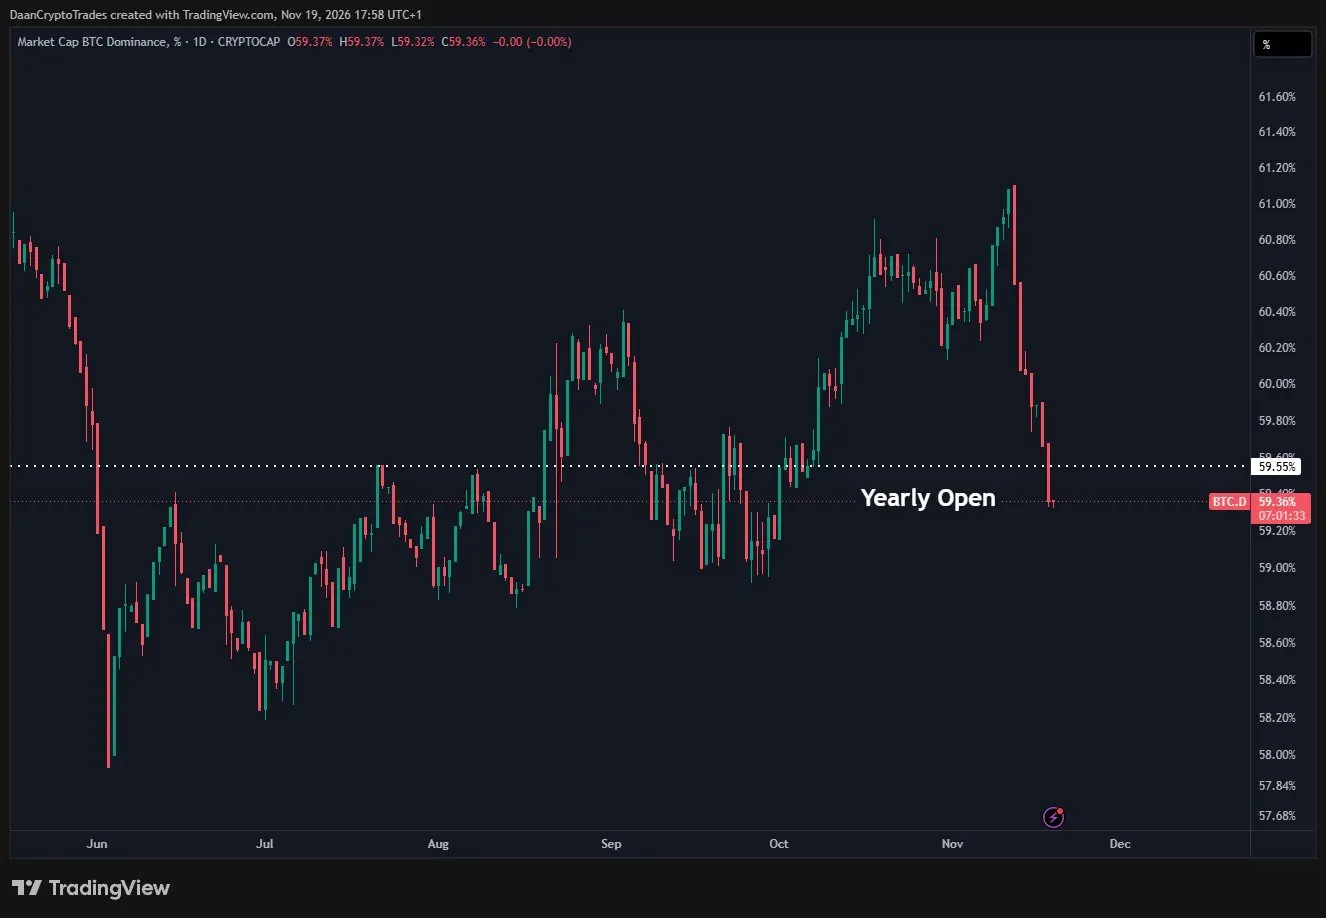
$BTC.D Has been trading down the past few days as majors have held up slightly better than $BTC.
But outside of the majors we've of course seen underperformance of most alts the past few days. Those will need a better market environment and risk appetite to return to perform.
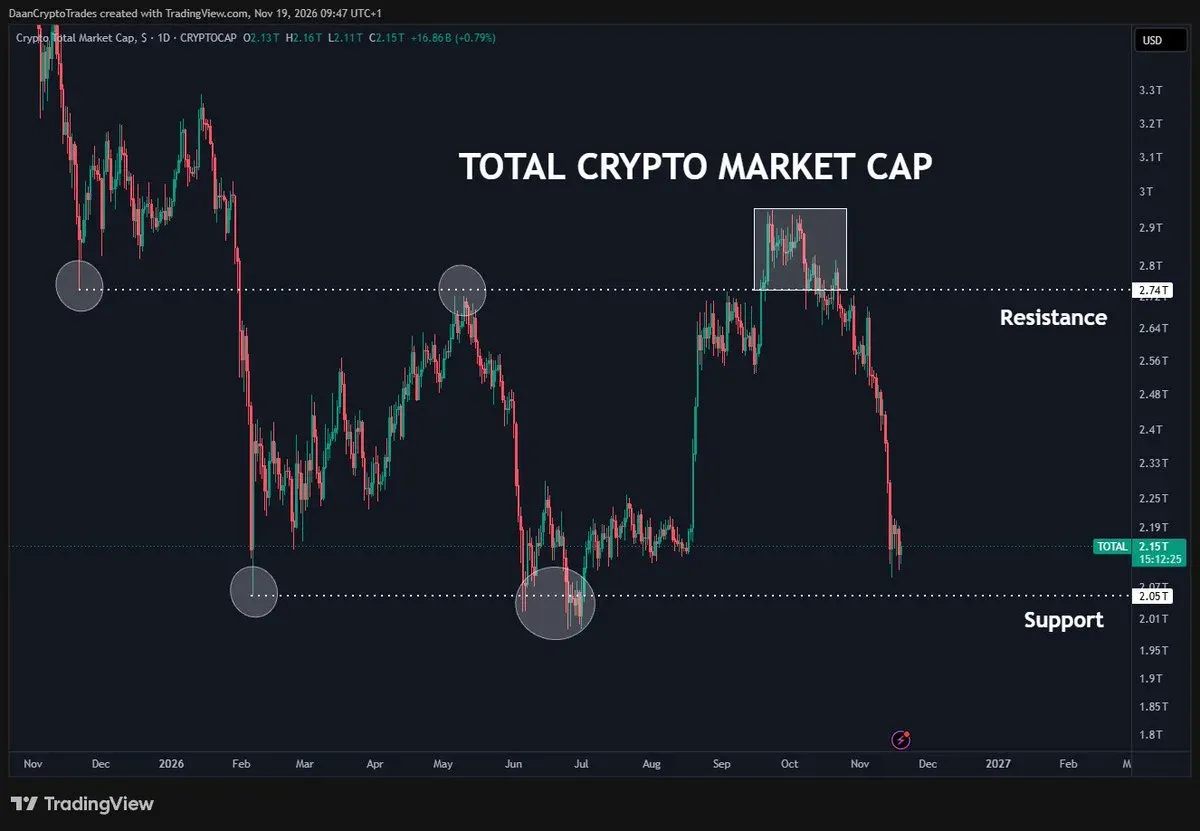
The Total Crypto Market cap has been in this giant range for the past 9 months now.
Bouncing between ~$2T-$2.7T
It doesn't hurt to put these levels on your chart and keep an eye on them. They correspond roughly with $60K & $80K for $BTC.
Don't get too bearish near the bottom and bullish near the top is generally a decent guideline.
And if you fail a breakout/breakdown that's a big reason to pay attention.
 ▼ Bearish
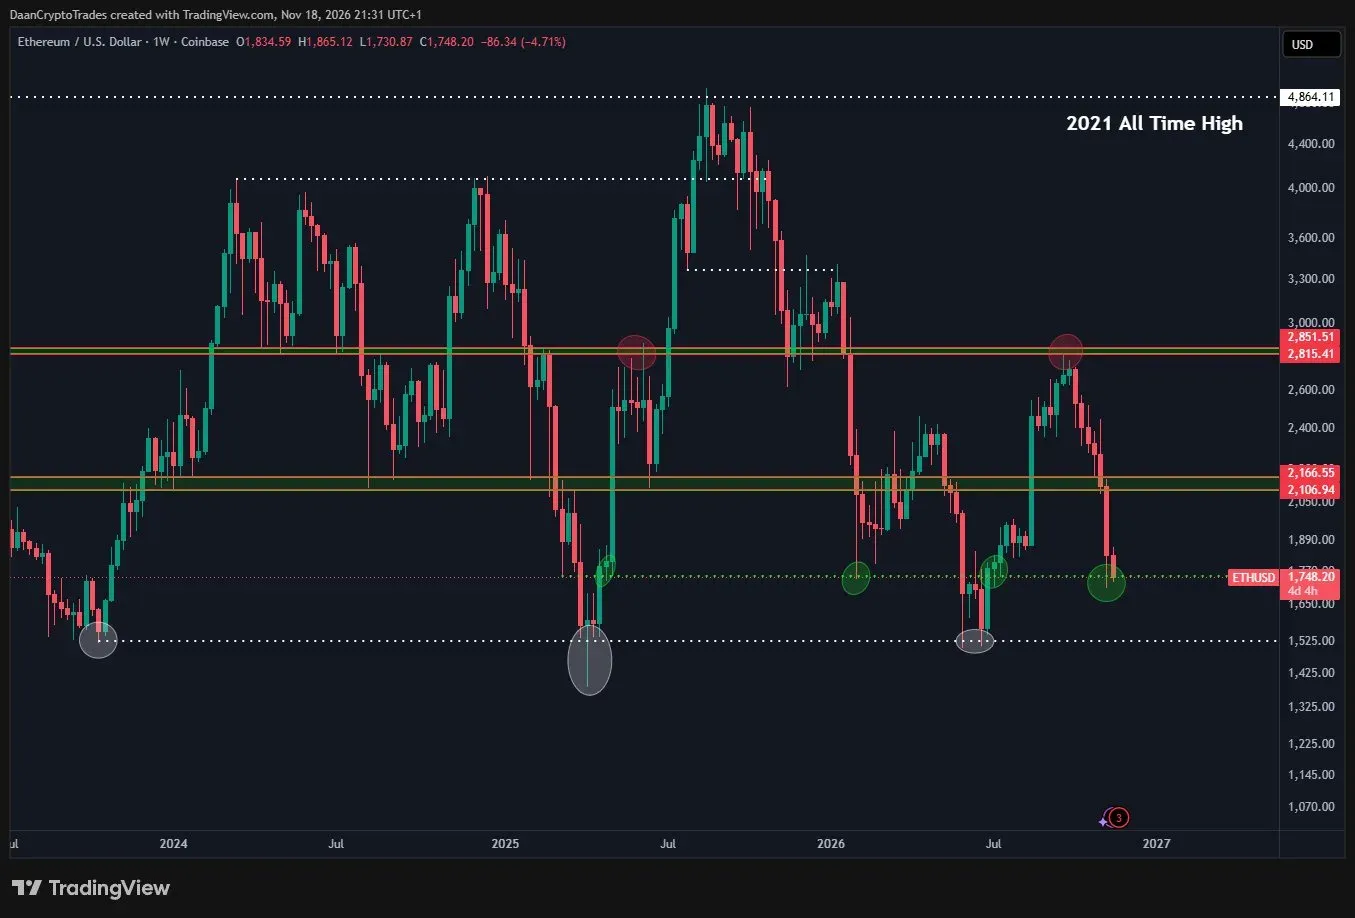
$ETH Remains stuck in this massive price range it has been in since 2023.
The $2.1K level did not give much support on the retest unlike last year.
$1750 is holding initially for now. If that one were to give in then we can watch for another test at $1.5K again.
Keep watching things level by level. That is one thing ETH has been good at doing. Clear one horizontal, go to the next. Reject? Go back to the previous.
 ▲ Bullish
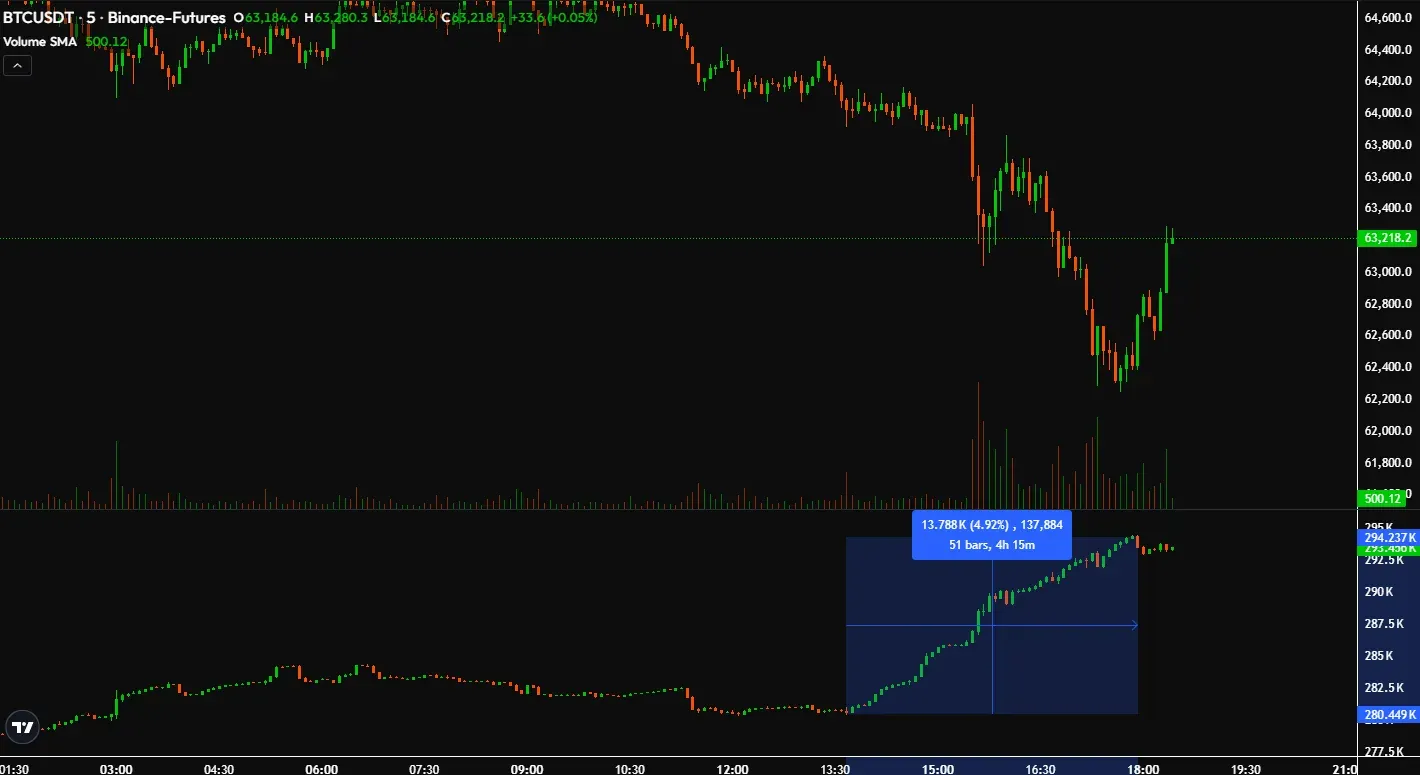
$BTC Interesting setup here. We've seen about $850M+ in Open Interest pile in into this low during the past 4 hours.
Considering we only moved down during that time I assume a lot of these are directional shorts.
A lot of them entered a bit above this price though so I would assume they really get tested at ~$63.6K and above. That could cause a bit of a squeeze.
Both long and short liquidations have been minimal the past few hours so far.
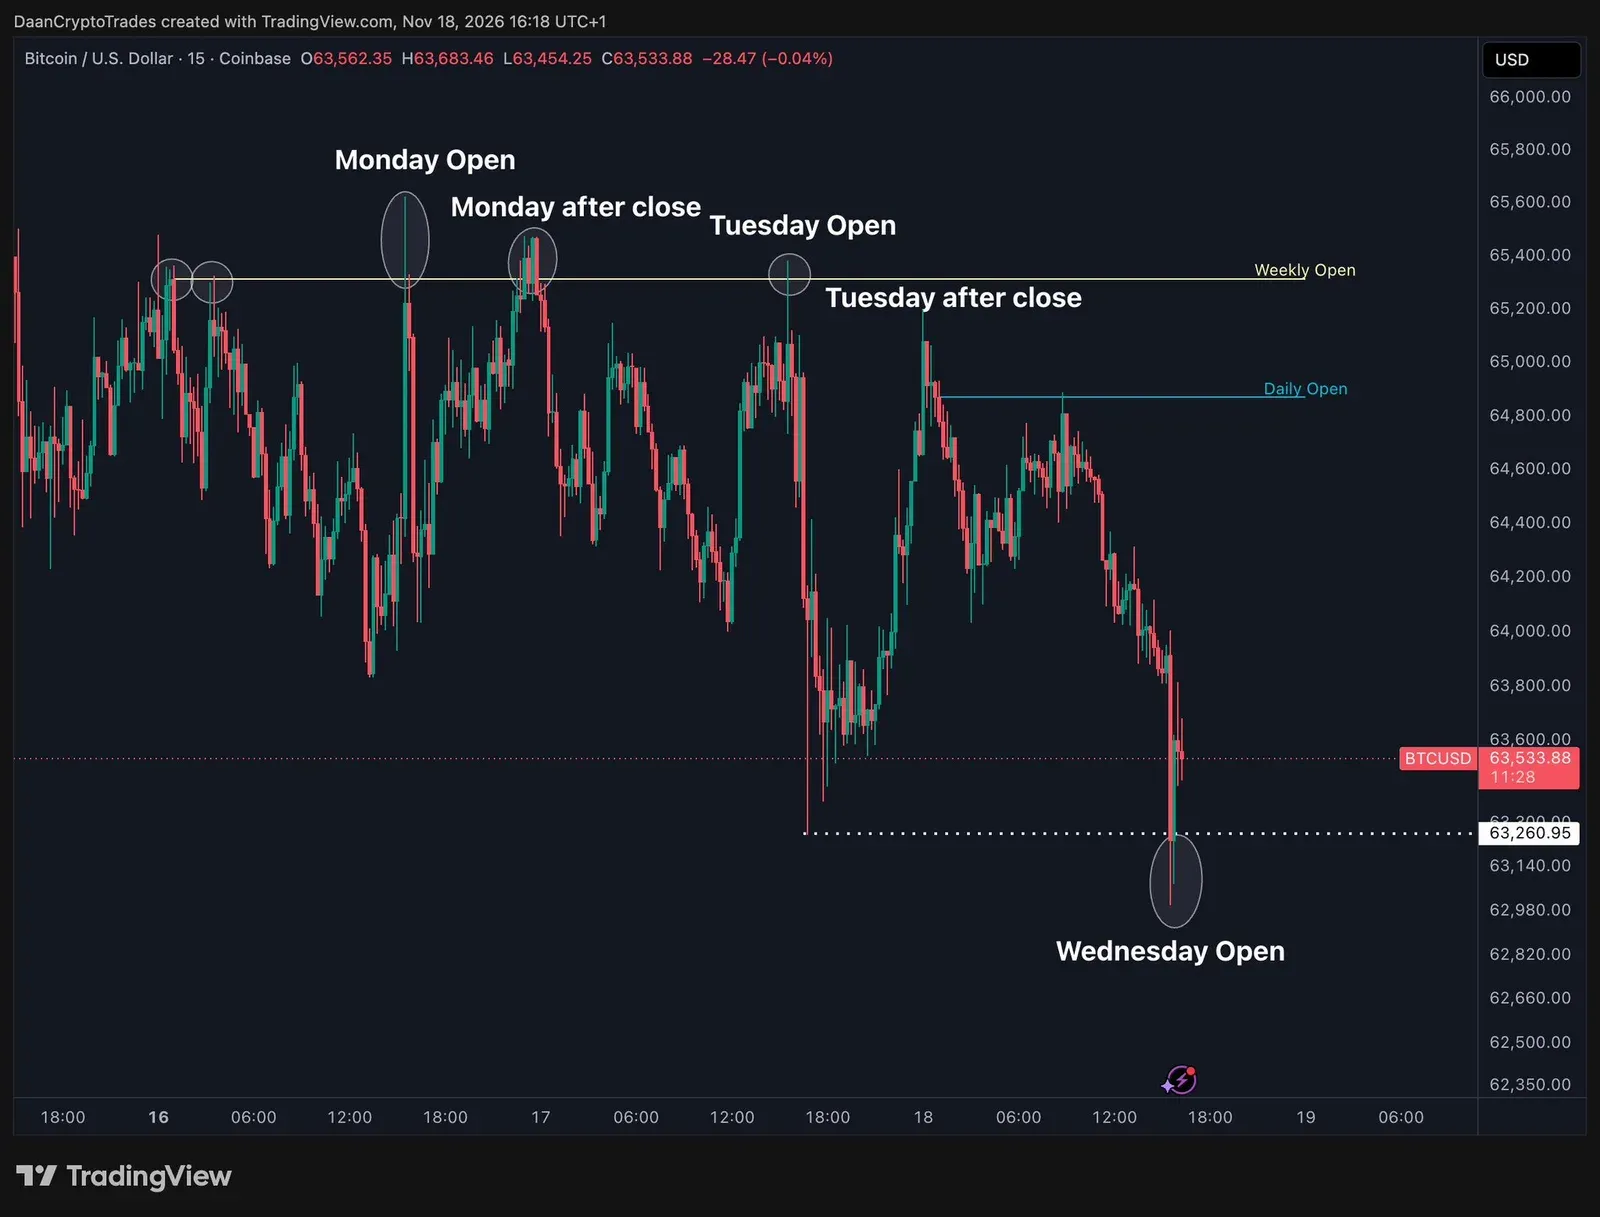
$BTC Yet another big move at the open. This time liquidity got swept below into a small local reversal from that candle.
Probably going to chop around for most of the day now until the later hour at the close.
But volatility is high and I doubt that changes anytime soon.
$63K & $65K are the intermediate targets where if you see multiple closes above/below you can start preparing for a bigger move. So far, price has not managed to sustain above or below either of those.
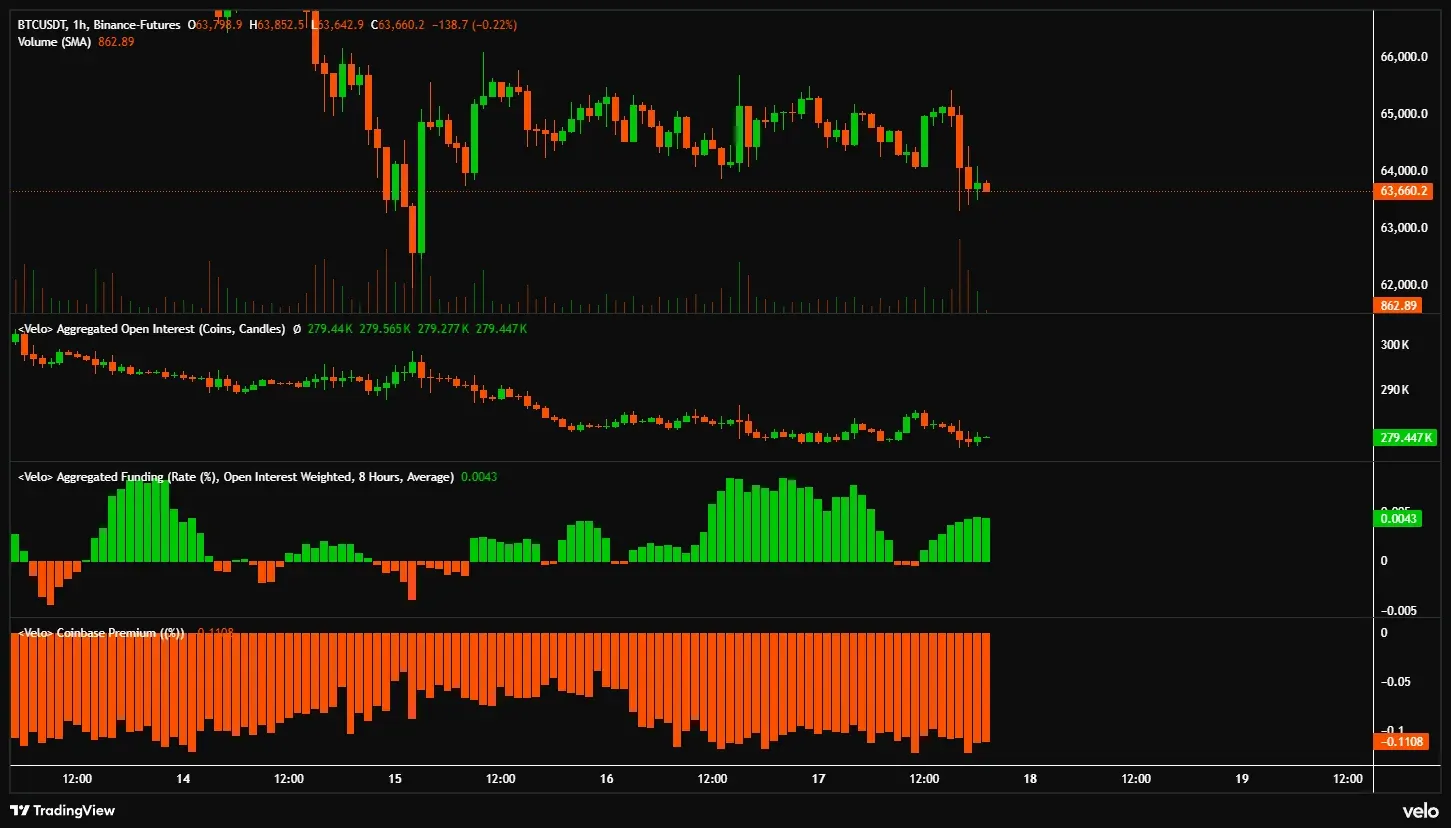
$BTC Open Interest has slowly been bleeding lower as both bulls and bears have been getting chopped up the past 2 days.
Coinbase discount remains low and funding rate is still positive.
Do think that major price insensitive seller from last week has somewhat stalled. But we're also not really seeing any major spot bid besides some slight passive absorption.
Nothing really noteworthy and we'll just have to remain patient.
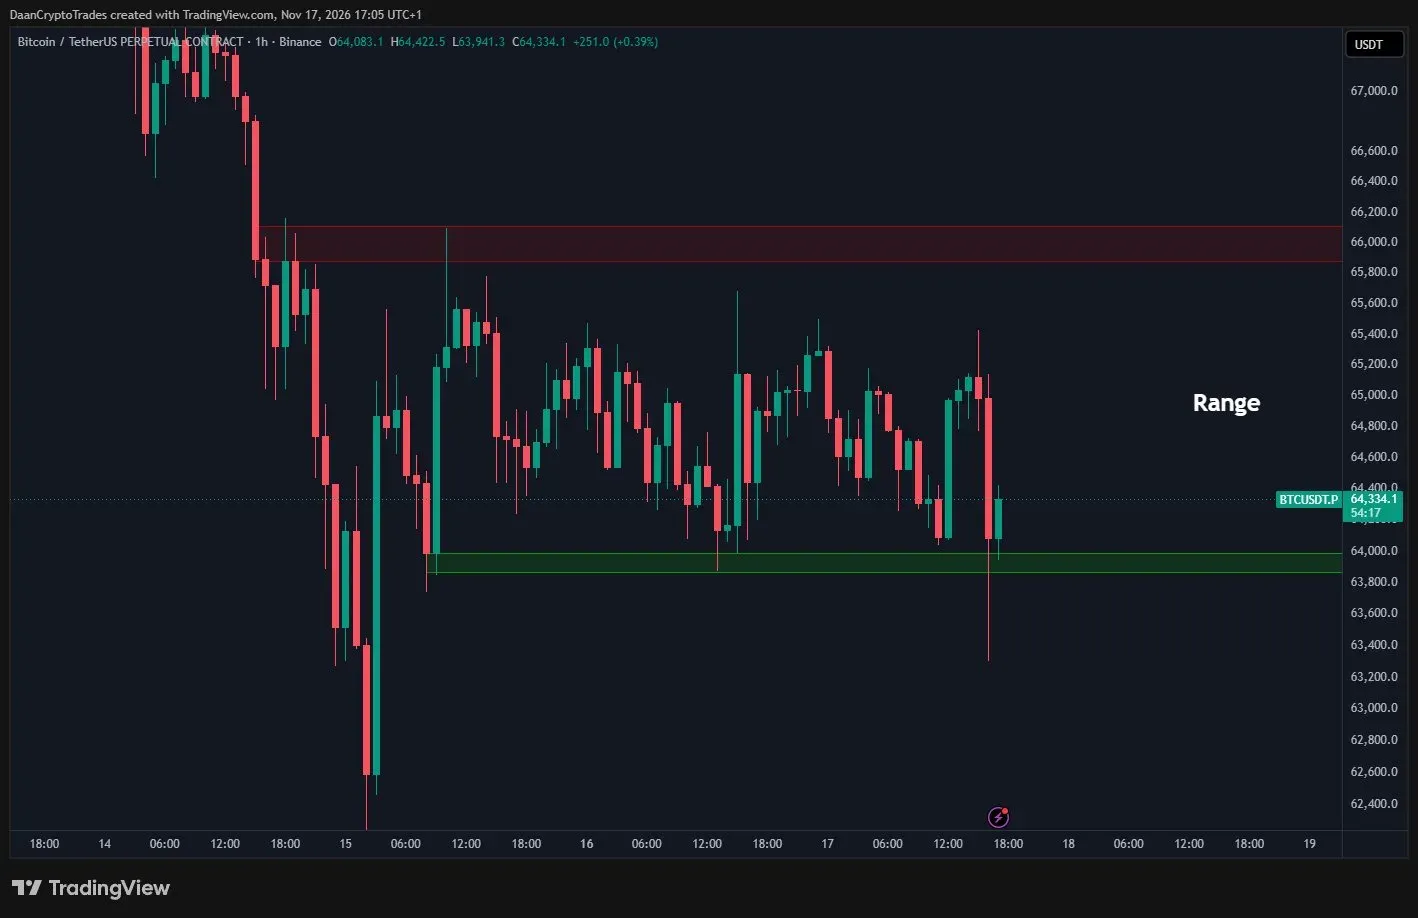
$BTC Range still holding, swept all the lows and reversed back up.
High volatility environment and will remain that way for a while I assume.
 ▲ Bullish
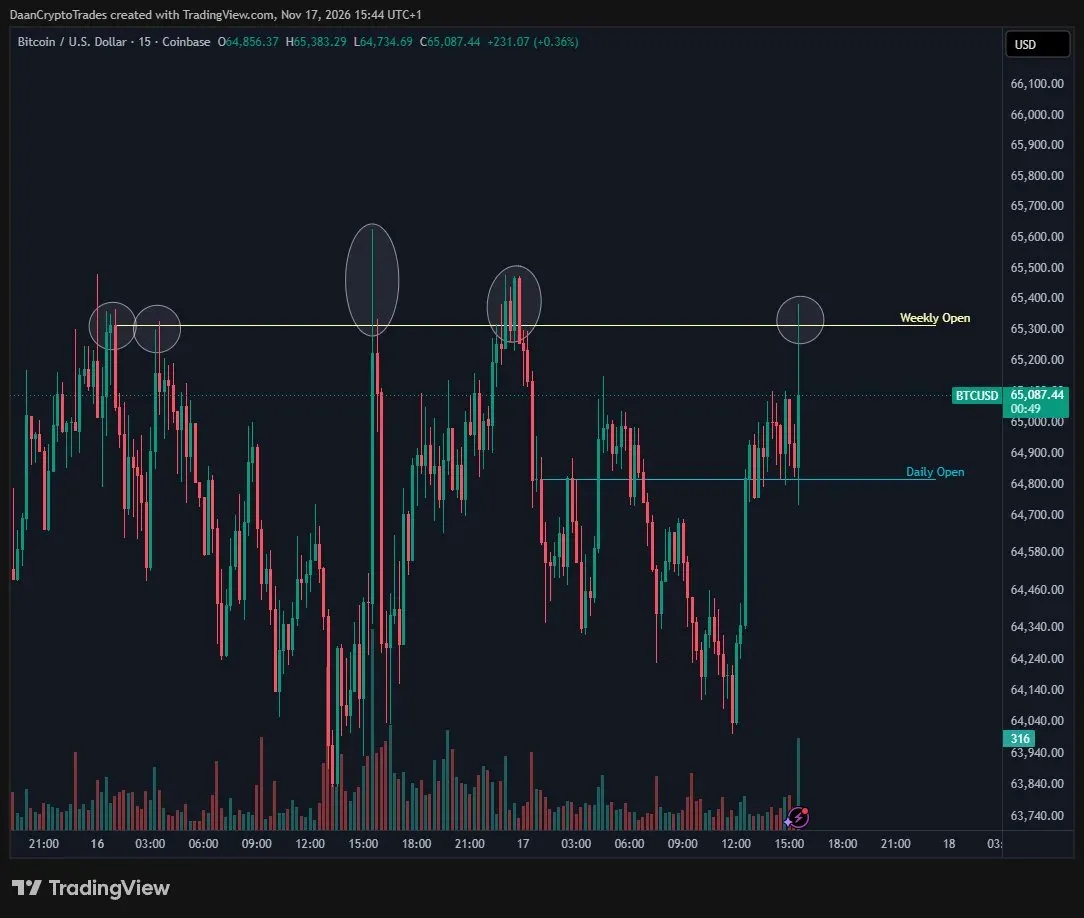
$BTC Has been having a hard time getting above the weekly open.
The current weekly high is still relatively weak seeing the move above has been small.
I would expect further acceleration if the bulls can manage a break and hold above that area.
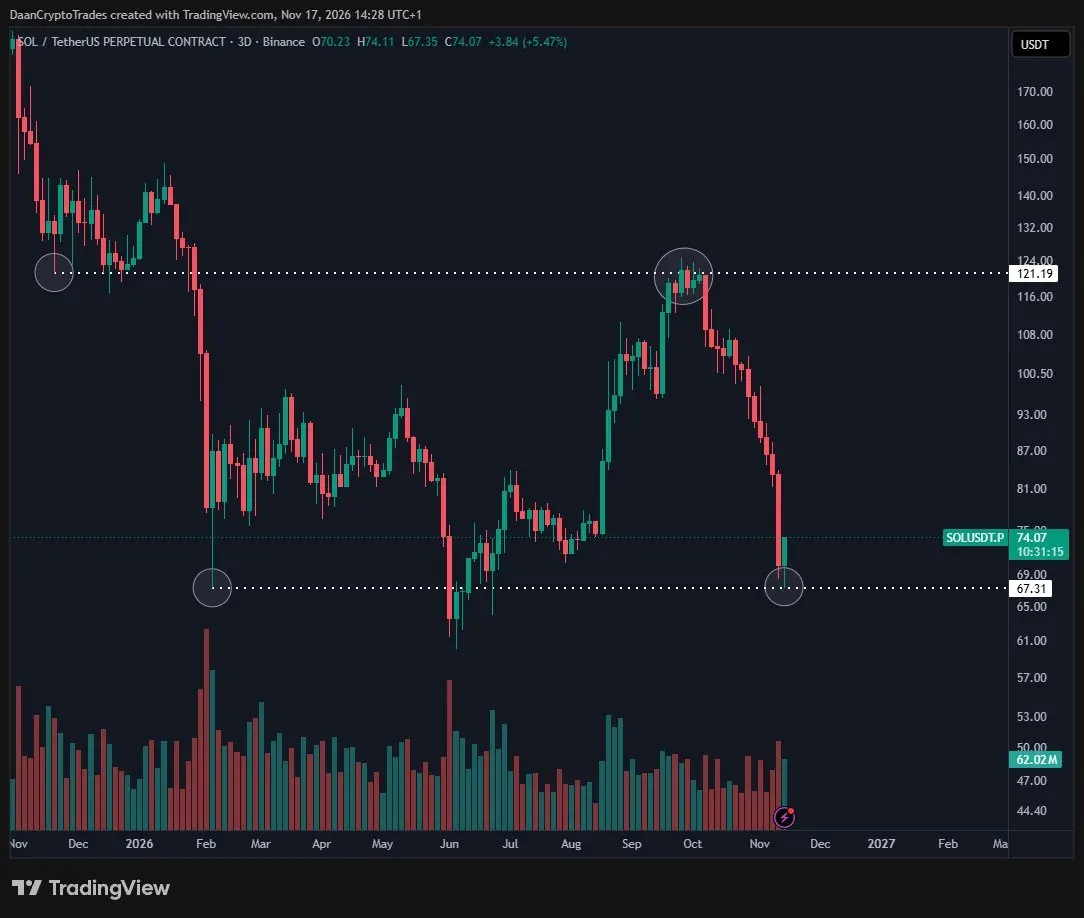
$SOL It is all a massive range in the end.
Can't get too bearish at the lows and bullish at the top.
The moves in between have been strong and very one sided.
 ▲ Bullish
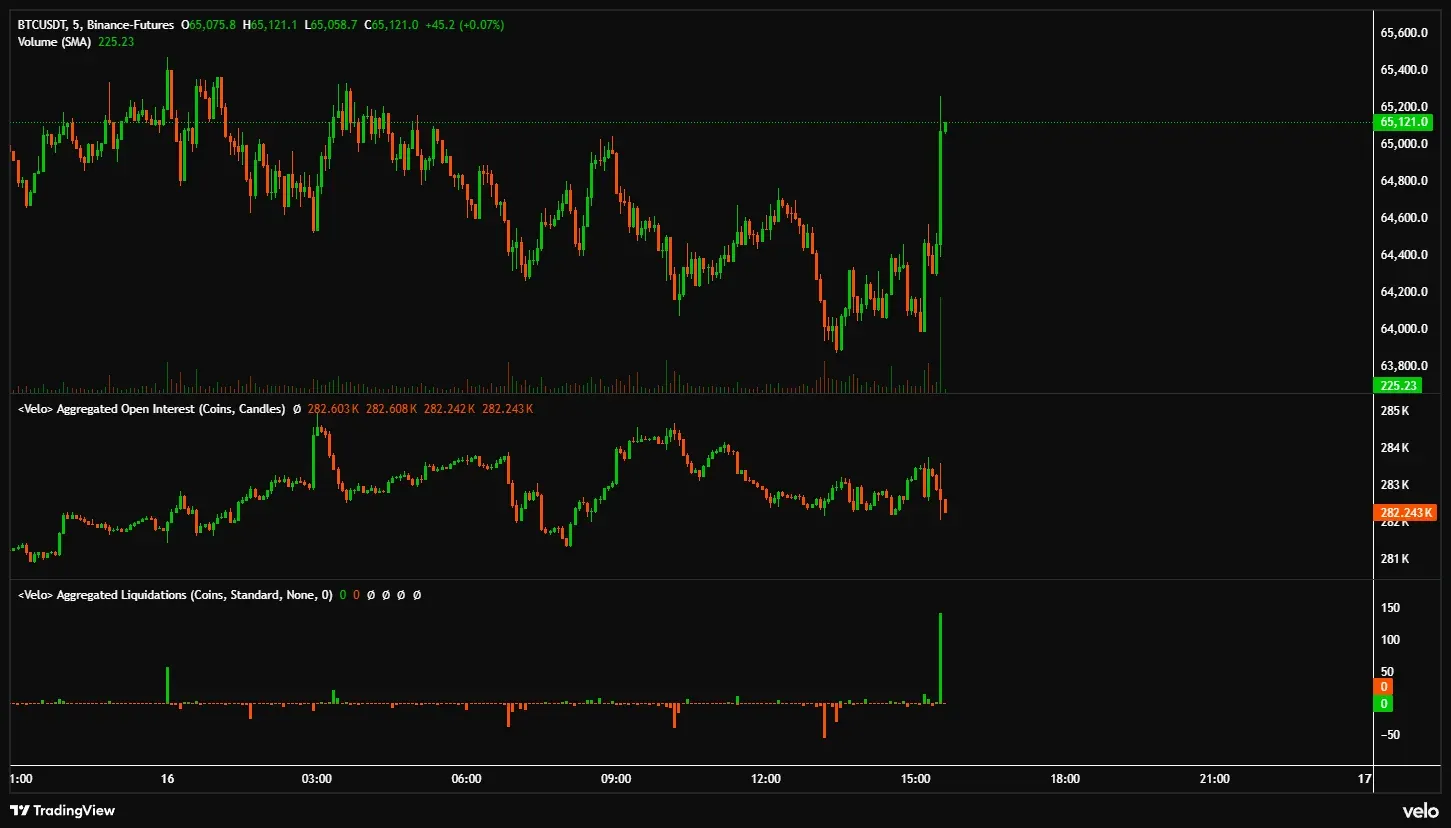
$BTC & $ETH Squeeze at the market open.
Some shorts being liquidated which is pushing prices up.
But the key signal for me will be whether spot steps in to help support the price over the next day(s).
Short squeezes or shorts taking profit can help get a move started, but for it to sustain you need spot support.
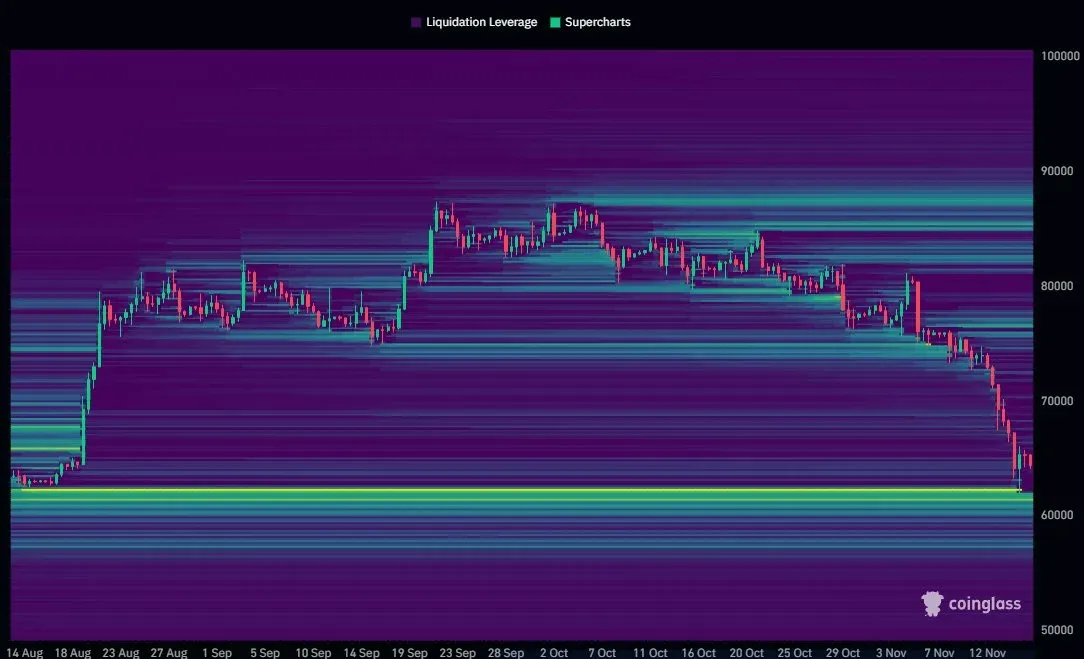
$BTC Took out the biggest liquidity cluster there was on the chart.
Rarely ever does it take these out after such a move but here we are.
There's no massive liquidity levels in close proximity right now.
Below $62K and above $75K would be the primary ones but neither of them are that big.
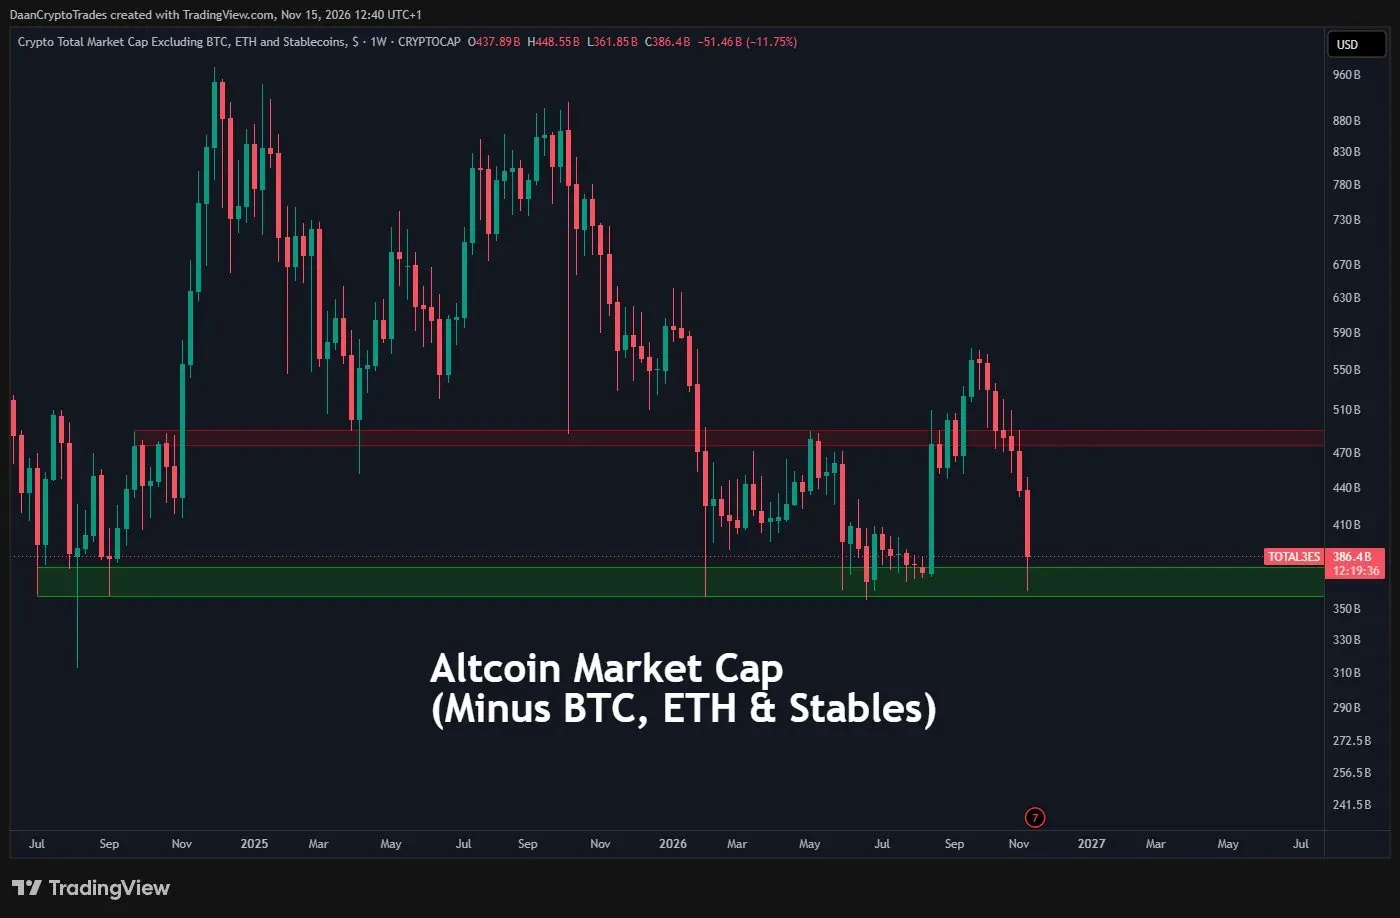
The Total Altcoin Market cap has retraced back to its 2024-2026 high timeframe support level.
This area was the base of the initial leg up during the summer and we've not seen a weekly close below it since early 2024. Key are to hold.
 ▼ Bearish
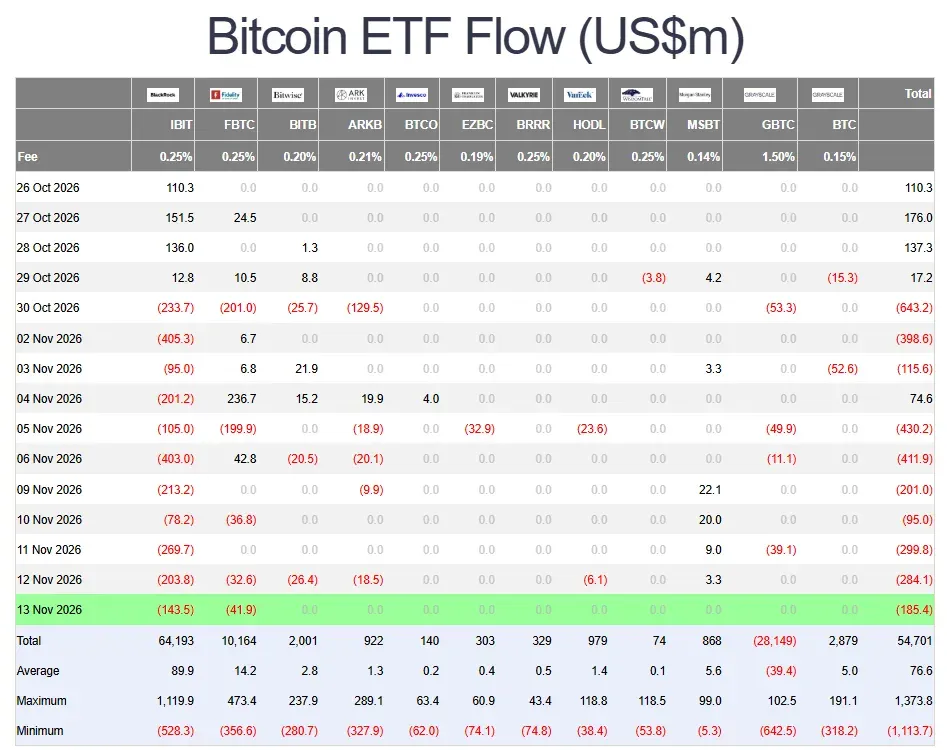
$BTC Is on a massive spot ETF outflow streak.
$IBIT has now seen 11 consecutive outflows of which most were $200M+.
In total Bitcoin has now seen $2.6B in outflows in just 2 weeks.
$ETH Has seen $2.5B in outflows since September.
The market will not meaningfully bounce until this pace of outflows stops. This is just ETFs as well and doesn't even account for all the other venues that have been hammering the spot prices recently.
 ▼ Bearish
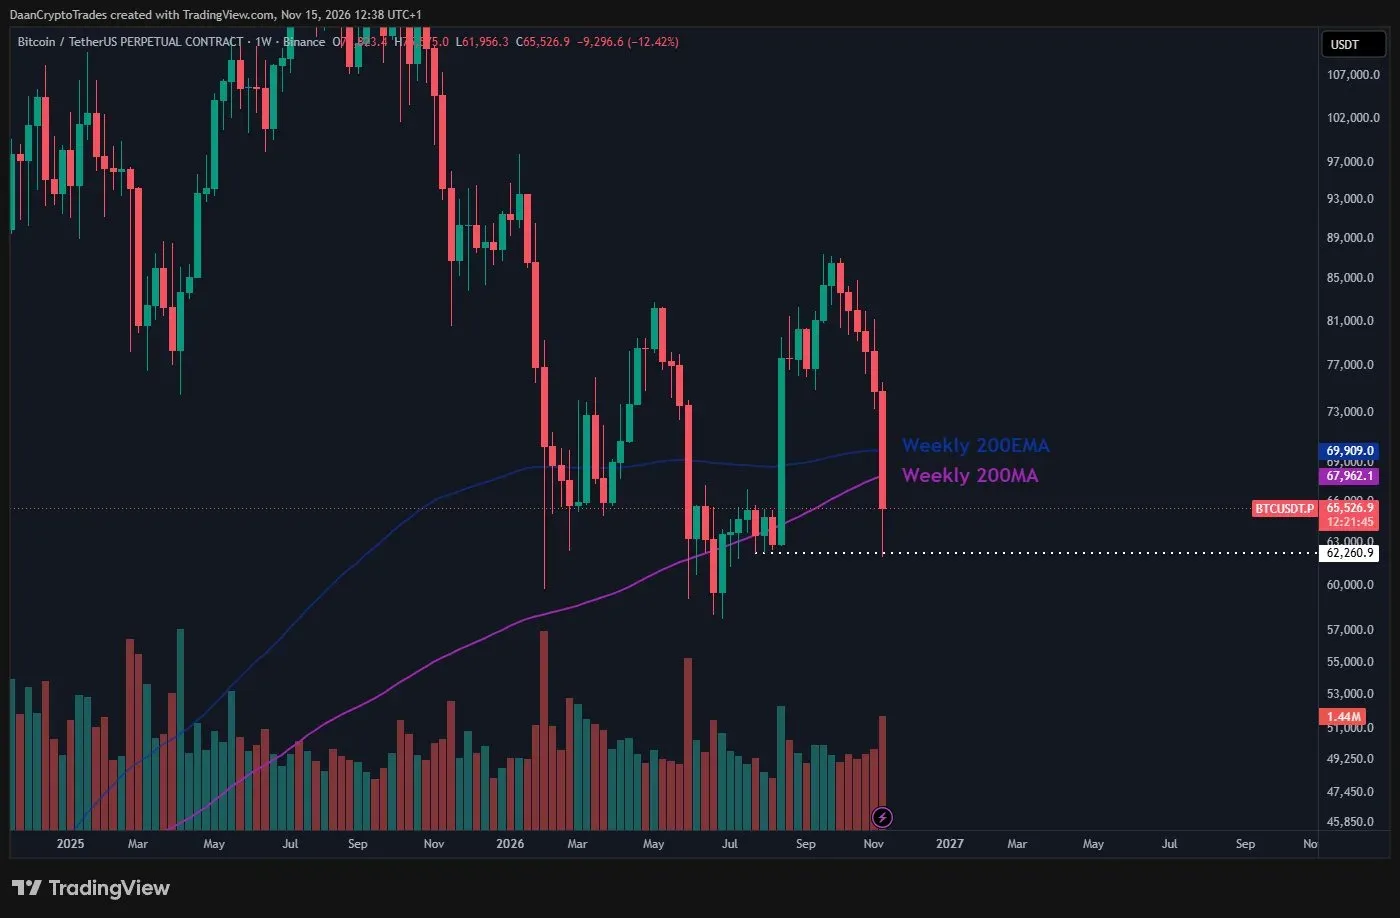
$BTC Full retrace of the entire august pump done with that wick.
It does look like the weekly candle will likely lose the 200MA/EMA which is something to be wary of, especially if it's not retaken soon after.
From here I'll be watching for a range to be formed locally and go from there.
 ▼ Bearish
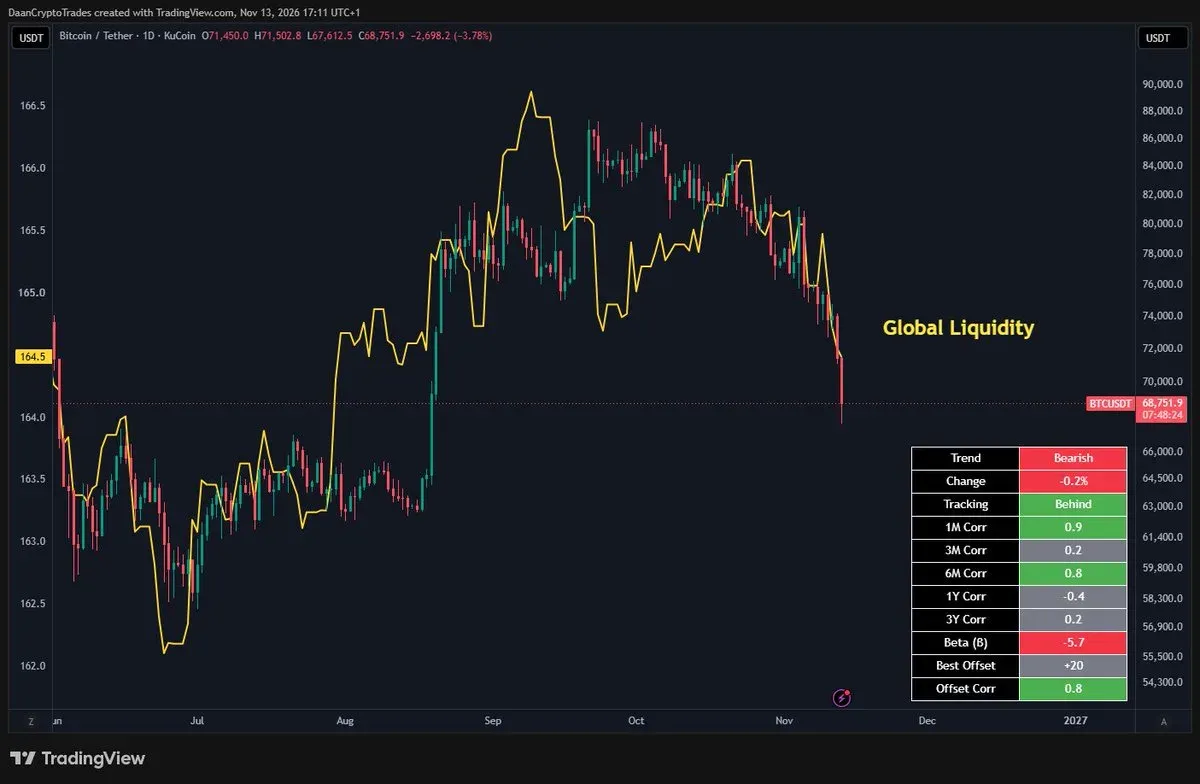
$BTC Has been following global liquidity quite well in recent months.
Whenever we saw a big spike up or down, bitcoin followed quickly afterwards.
Currently it has been declining steadily since the end of October. Bitcoin has now pushed ahead of it towards the downside.
A reversal in global liquidity would surely help support assets like Bitcoin and metals. Something they are lacking a lot now.
 ▼ Bearish
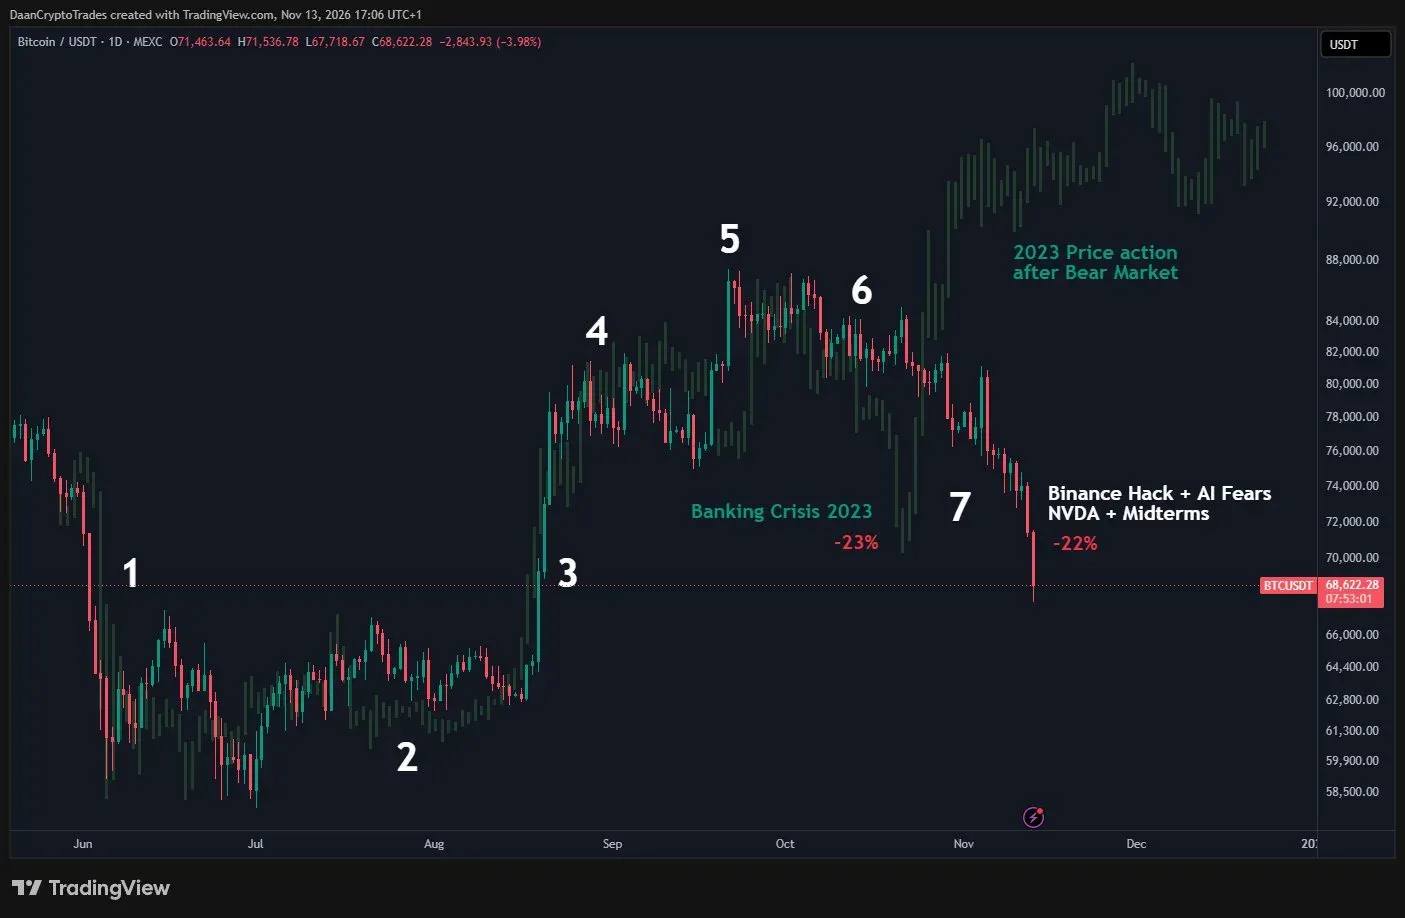
$BTC Fractal update:
The consolidation and drawdown took a bit longer but in terms of price movements they are now near identical.
1. Sharp leg down to new lows
2. Bear Market Chop near bottom
3. Violent breakout
4. Sideways
5. New leg up
6. Start of slow bleed down
7. Acceleration lower
In 2023 this was about the level where people gave up and calls for new bear market lows were made. Let's see how today's situation plays out. Both drawdowns are now pretty much identical in percentages.