Daan Crypto TradesTrader
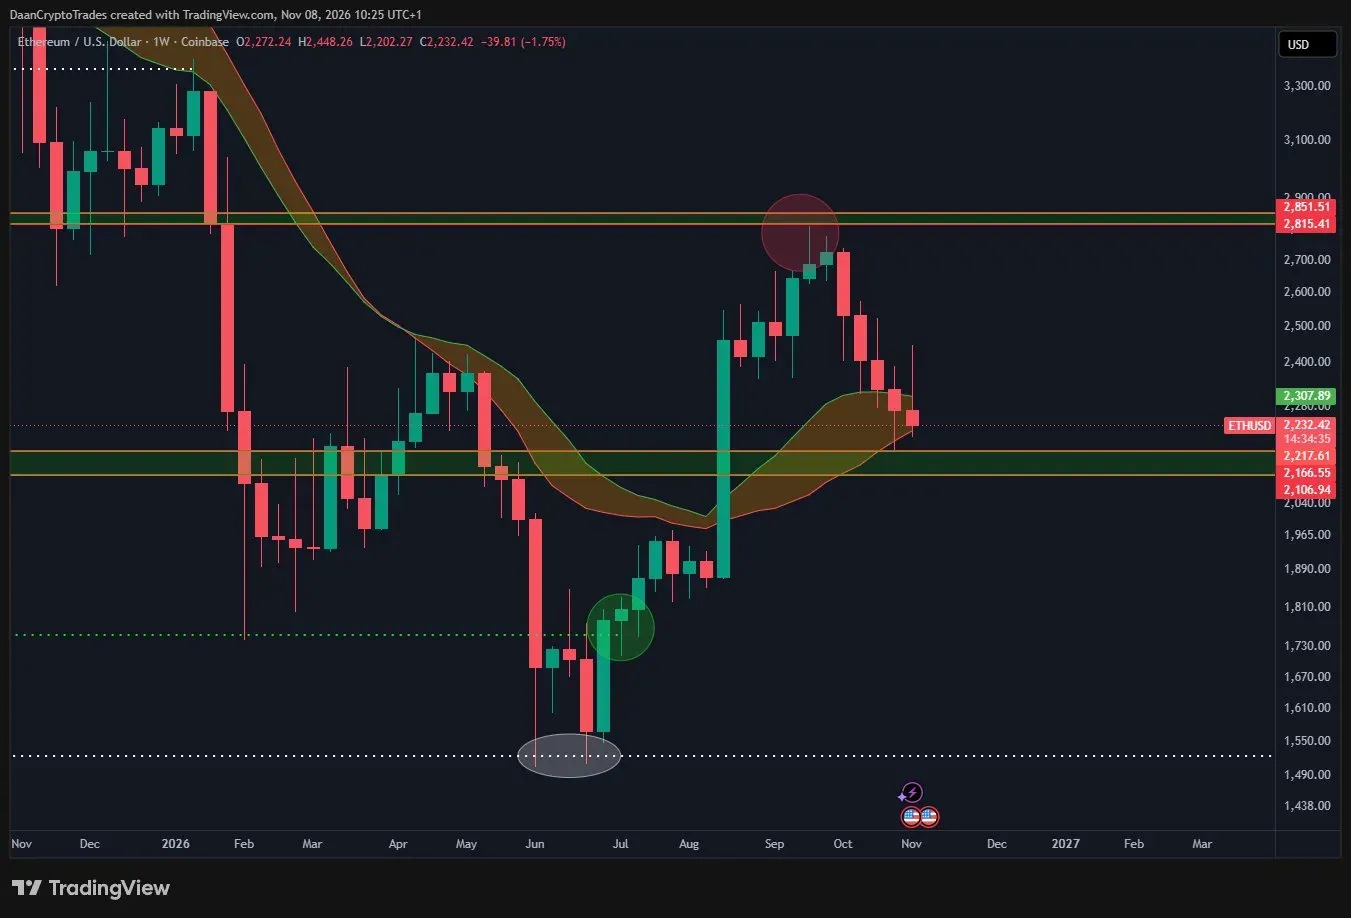
▲ Bullish$ETH Mengulang playbook 2025 sejauh ini. - Bottom sekitar $1500 - Mengambil kembali $1750 dan mempercepat dari sana - Gagal retest $2800 - Penolakan kembali ke $2100 - Bounce?
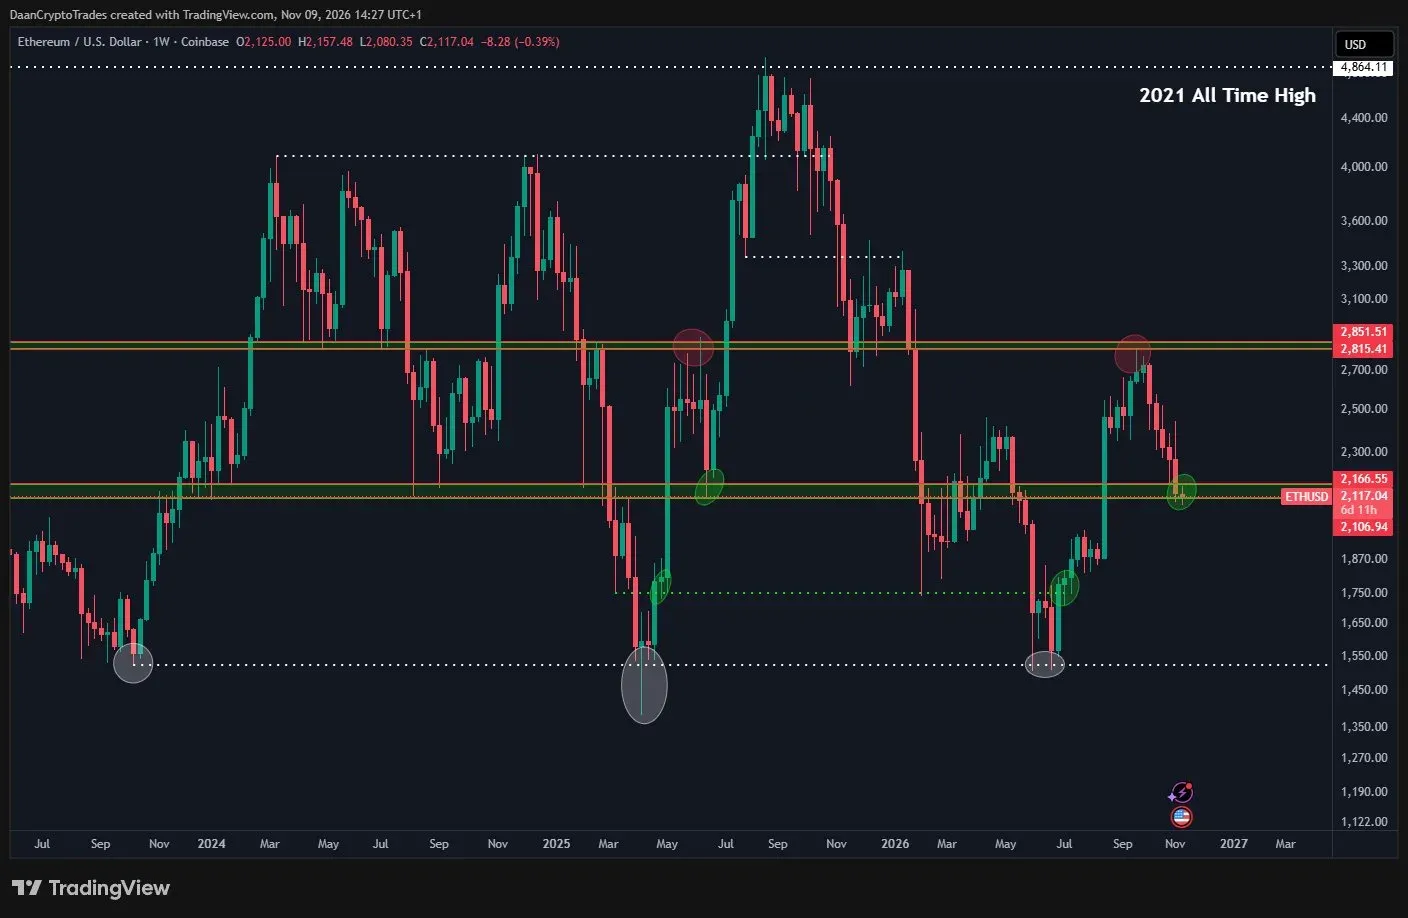

$ETH Mengulang playbook 2025 sejauh ini. - Bottom sekitar $1500 - Mengambil kembali $1750 dan mempercepat dari sana - Gagal retest $2800 - Penolakan kembali ke $2100 - Bounce?
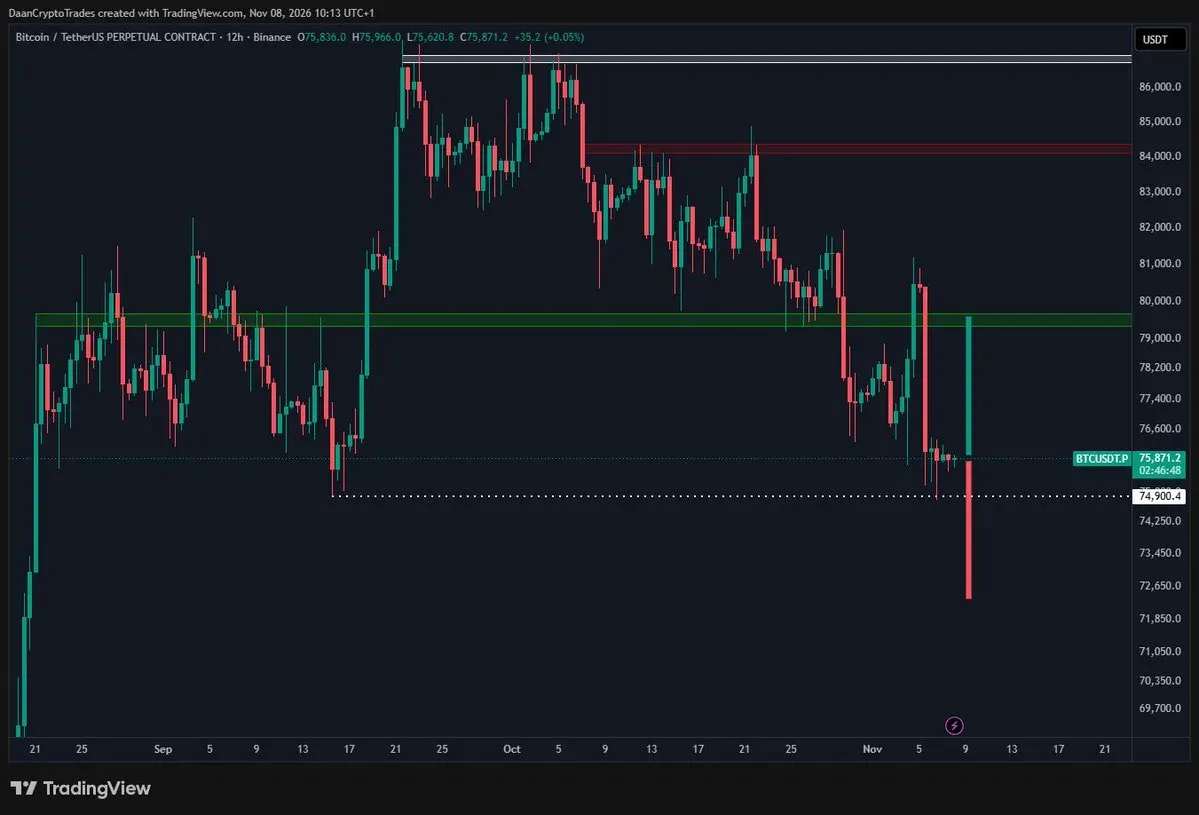
$BTC Semua level terendah dalam rentang ini sudah terlewati. Sekarang mari lihat apakah para bear akan menurunkan harga lebih jauh setelah break down, atau apakah aksi harga akan stagnan dan kembali ke rentang/level terendah sebelumnya. Yang terakhir cukup tipikal untuk kebanyakan konsolidasi selama beberapa tahun terakhir (saat tren naik). Dalam kasus ini, kembali ke $75K dan tetap di atasnya akan menandakan bahwa harga siap naik lagi.
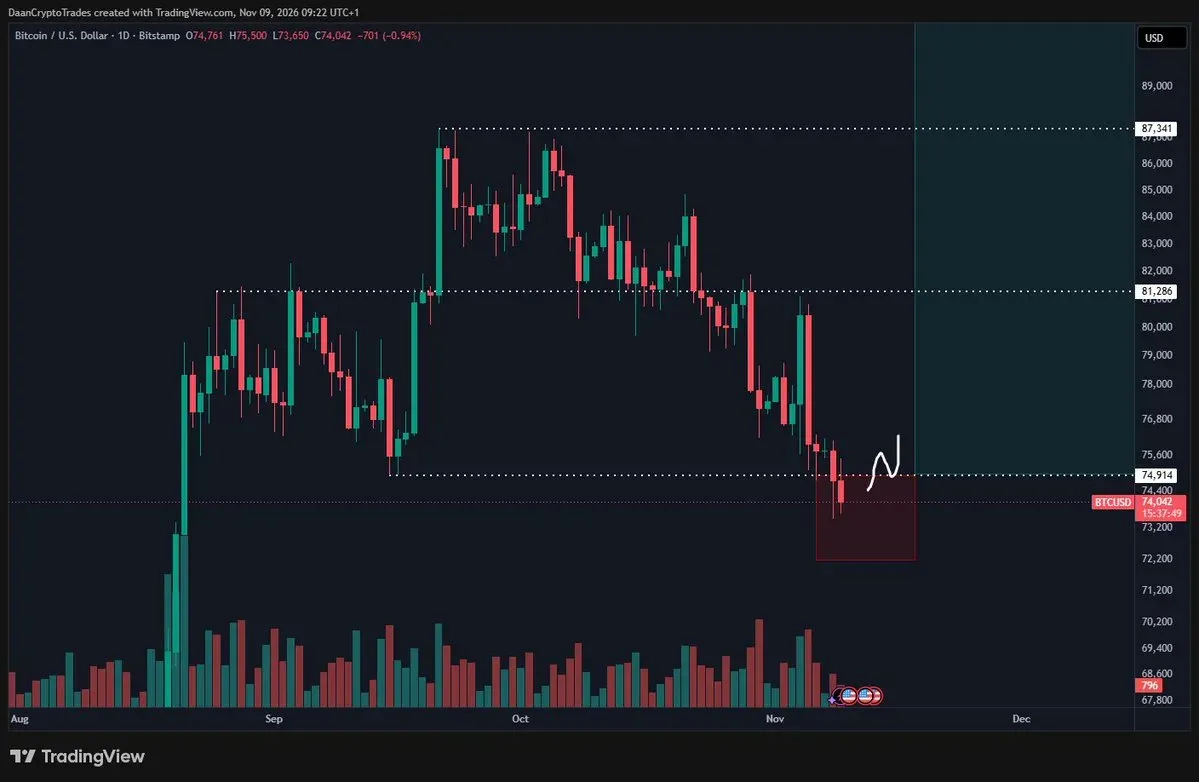
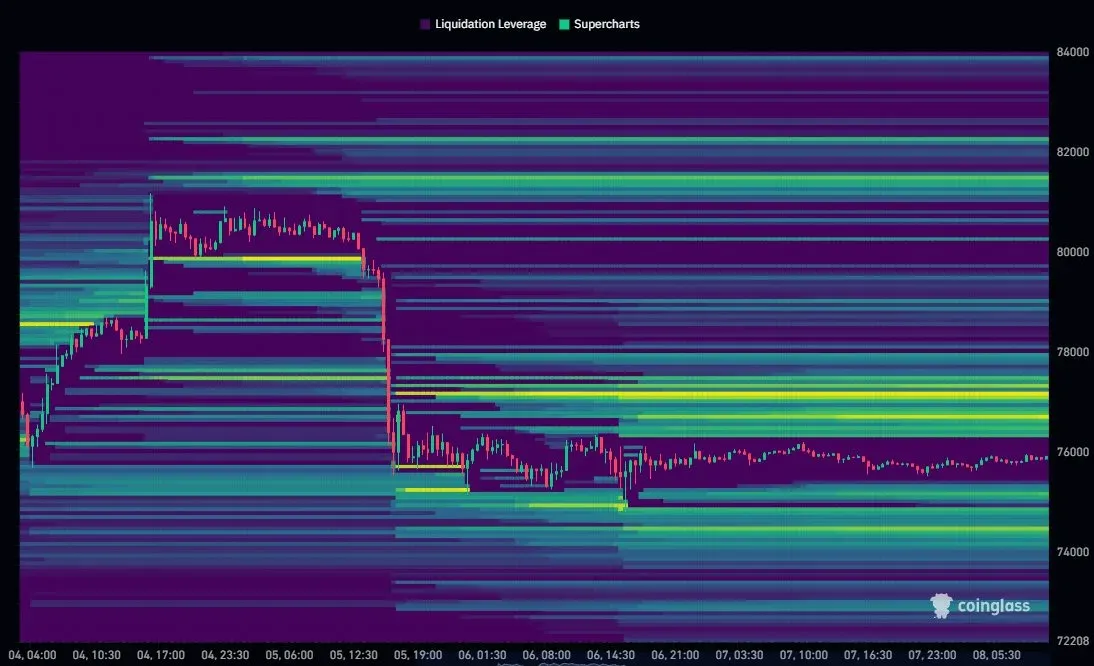
$BTC With how this is shaping up, I am expecting volatility to remain high and for a decision to be made soon. Locally, $75K & $77K are the levels to watch. I do believe a break of either of those, could accelerate quickly and make for another ~5% move. There isn't much stopping the move in either direction until that ~$72K-$73K zone and above it would be back to ~$80K.
$ETH Sitting right at its bull market support band. These past few candles have been trying to hold on to the retest. ETH first broke below the bull market support band back in October 2025, after which it rejected on all its tests. August was when ETH finally broke above in violent fashion, now the bulls need to hold on to it as support to create a higher low. Eyes on the closes.
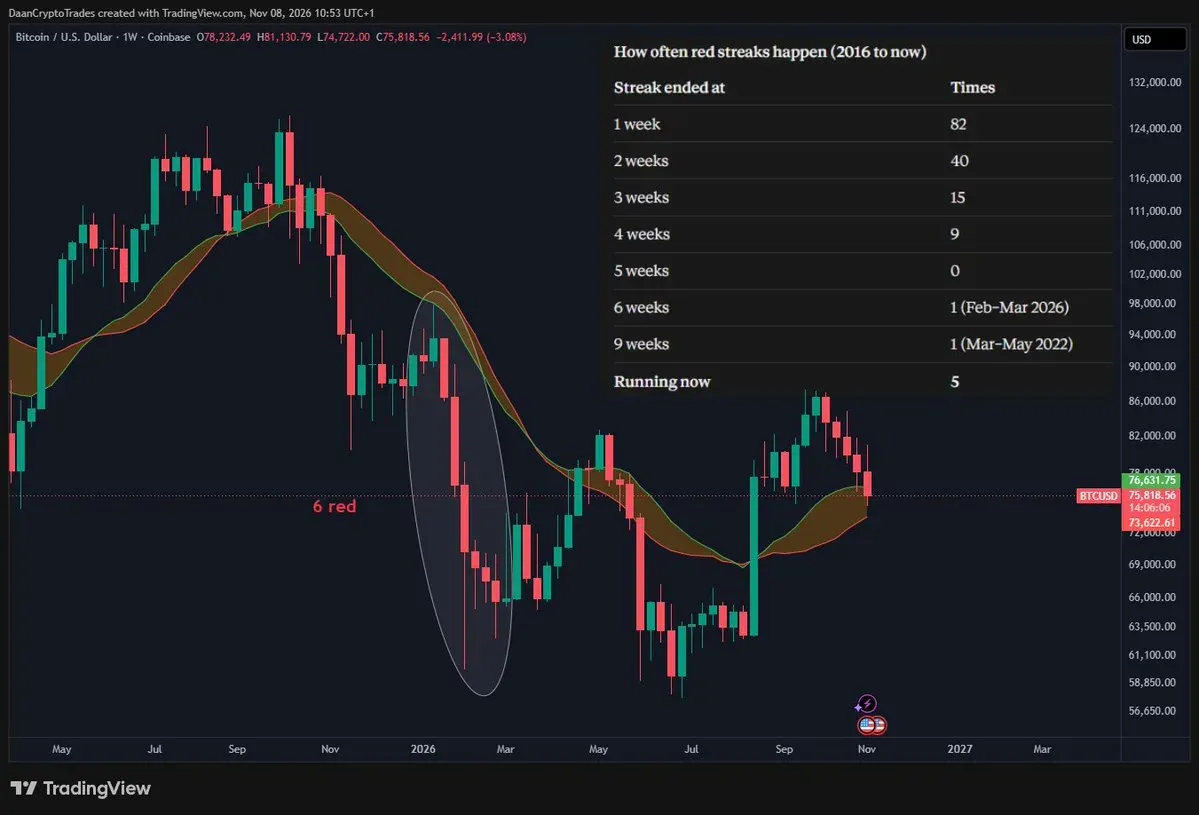
$BTC Is about to close its 5th consecutive weekly candle in the red. The last time we hit 5+ was this February when it topped at 6. The only other time before that was all the way in 2022 when we saw 9 consecutive red weekly candles. So to see 5 in a row is quite a rare sighting. The other two streaks happened in middle of a bear market and when price traded below the bull market support band in a bearish structure. Next week is going to be interesting as I suspect we will get a resolution on this either way. Eyes on the weekly closes.
$BTC After the volatile mid-week, price has been sideways for the past two days. This makes it so there's a lot of positions that have built up on both sides. Decent chance there will be a liquidity grab for both sides at some point.
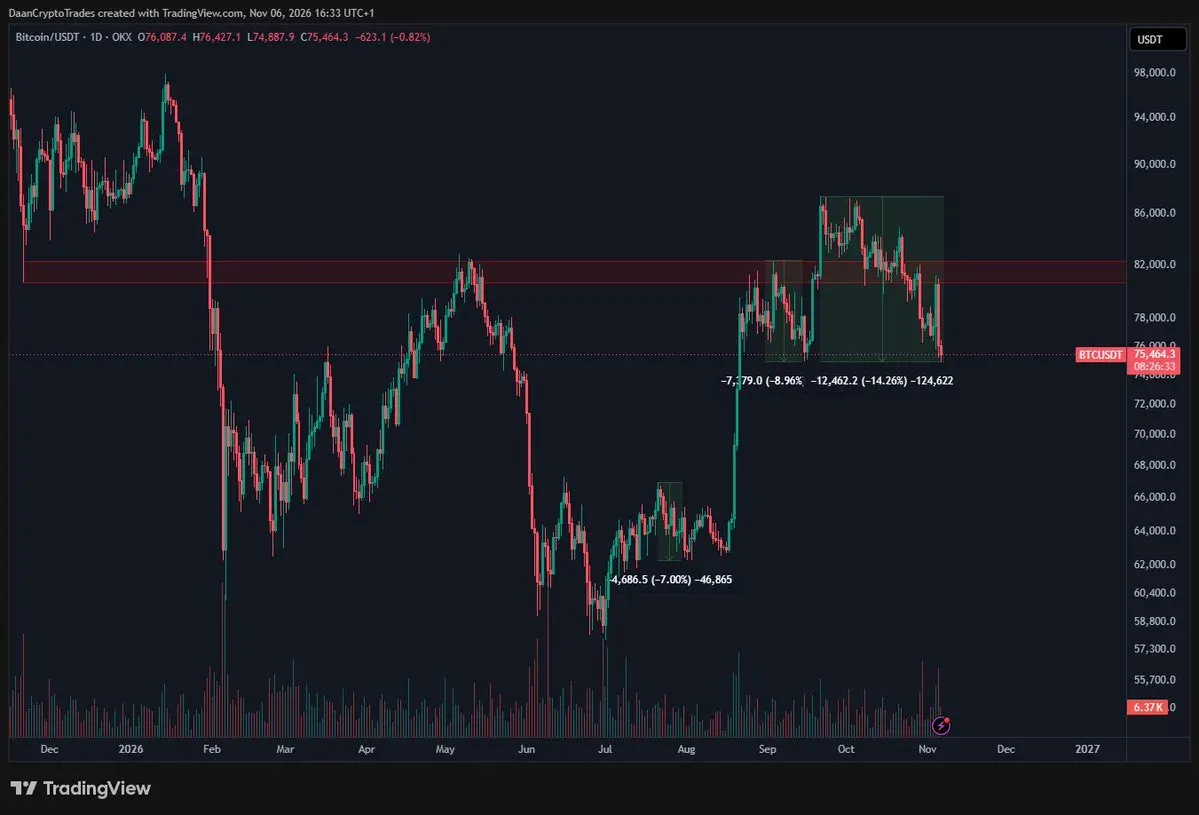
$BTC Holding on to the $75.5K support after that massive flush which swept the September low. Above, that $81K level has been important. Main level for the bulls to break to get the momentum back.
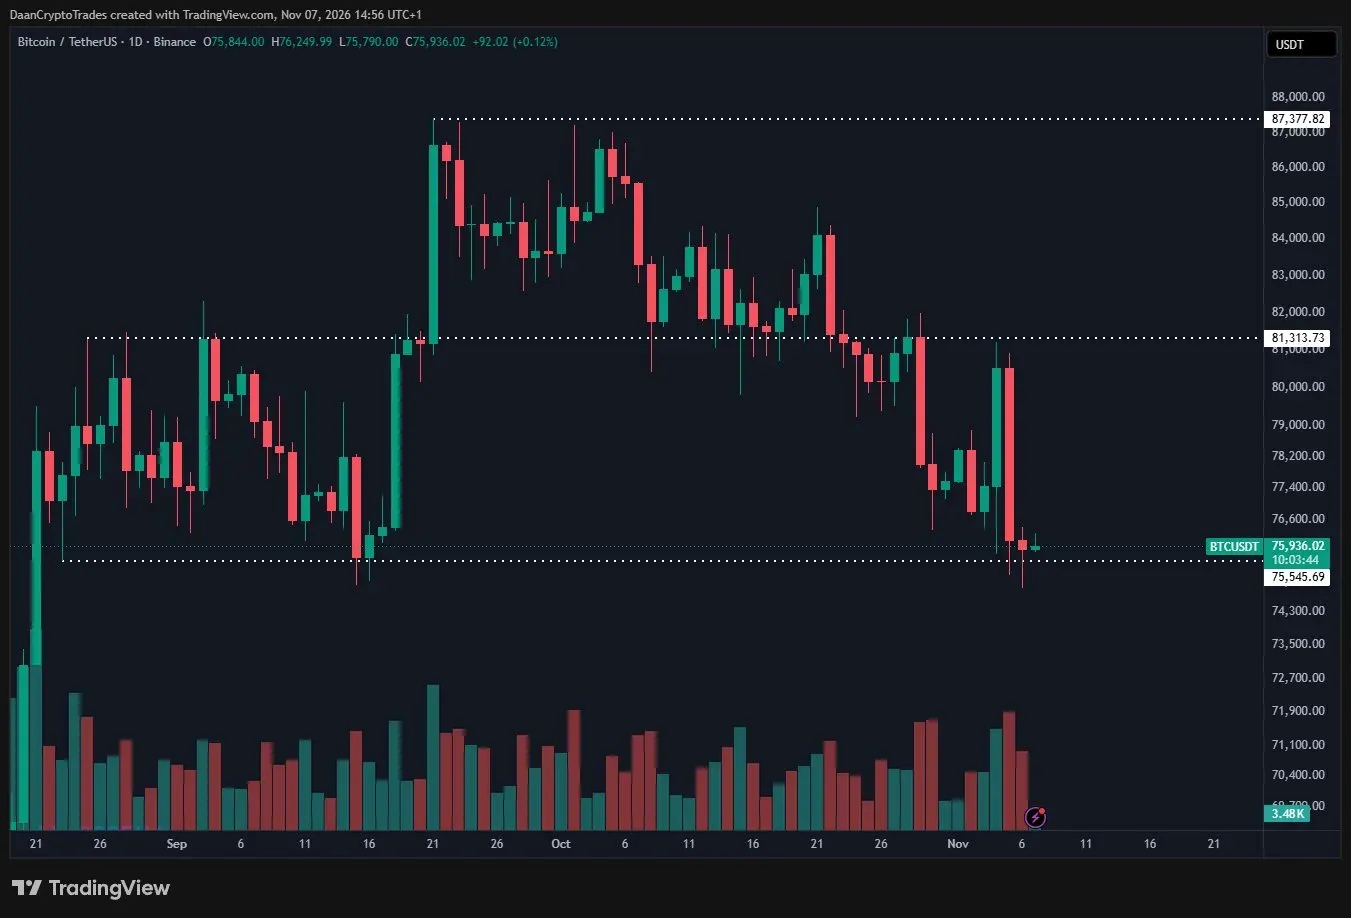
$BTC Now with its largest drawdown since the $58K to $87K rally. I don't have to tell you that corrections like these are normal for Bitcoin. Volatility in general has actually already been much lower than prior years. But for the high timeframe structure to have some proper bullish momentum again, you'd need to see a break back above $80K. Below this $73K-$76K zone is the big high timeframe support region to watch.