$BTC · Ide trading
Setup, grafik, dan pandangan pasar kripto dari trader dan analis. Bitcoin, Ethereum, dan altcoin, bullish dan bearish. Bukan saran keuangan.
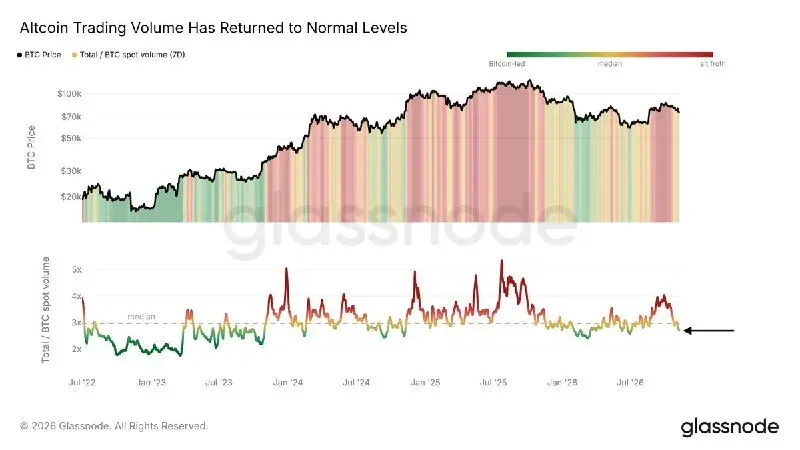
Altcoin trading volume has returned to normal levels.
Through September, total altcoin volume spiked up to 4x Bitcoin's, marking a period of altcoin froth.
As is often the case, this speculative alt activity coincided with the local market top, with $BTC peaking around 87k.
 ▲ Bullish
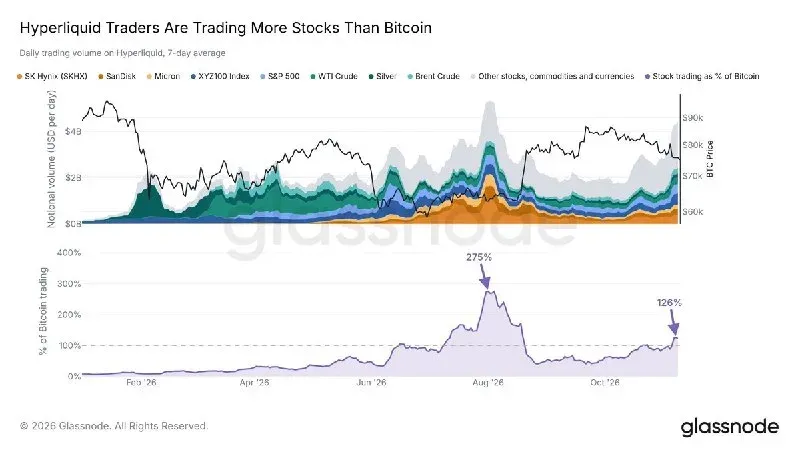
Volume saham di Hyperliquid kembali melampaui volume $BTC.
Baik Bitcoin maupun saham telah turun selama beberapa minggu, namun trader kripto tampaknya mengejar penurunan saham.
Terakhir kali rasio ini mencapai puncaknya, pada bulan Agustus, BTC berada di dekat level terendahnya sebelum breakout.
 ▼ Bearish
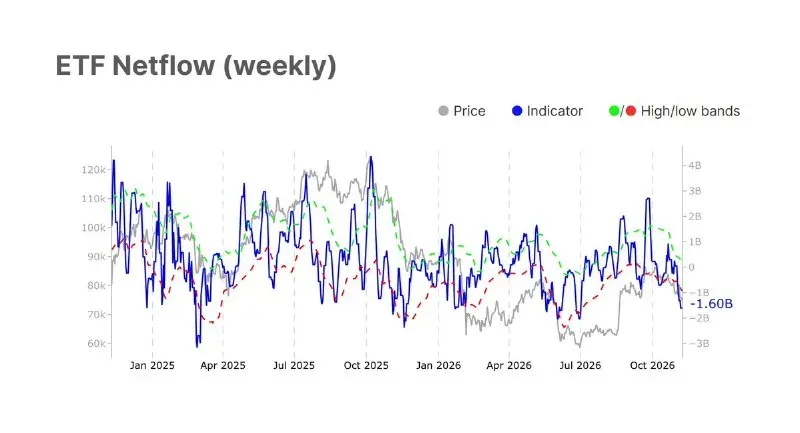
$BTC diperdagangkan di sekitar $75k pada Senin setelah upaya gagal menembus $80k. Penarikan ETF merupakan yang terberat sejak awal Juli dan pemegang jangka pendek hampir break-even, sementara leverage dan permintaan perlindungan tetap tinggi.
Baca BTC Market Pulse terbaru kami 👇
 ▼ Bearish
btc mengendus -0,0001% dan altcoin turun, begitulah pasar seperti ini
 ▲ Bullish
#Bitcoin adalah aset dengan beta lebih tinggi daripada indeks.
Jika indeks tidak bagus, #Bitcoin terjual, dan sisa pasar turun bersama.
Namun beberapa #Altcoins tidak menunjukkan kelemahan dalam beberapa hari terakhir, yang menandakan perubahan arus sedang datang.
Saya telah melakukan penyesuaian kuat pada portofolio #Altcoin saya karena itu, dan saya berharap jika pasar rebound, beberapa akan bergerak besar.
Saya sangat ingin melihat pasar AS dibuka hari ini.
Jika koreksi terus turun, kita berada dalam koreksi tajam pada indeks (dan Anda bisa berargumen bahwa pasar #Bitcoin cukup kuat).
Namun, jika mereka memantul naik, saya juga mengharapkan #Crypto memantul lebih kuat.
Ini cukup sederhana.
Apakah memantul di sini (dan menutup harian di atas $75.000), atau kita akan mengalami penurunan dalam minggu ini yang dalam lagi.
 ▲ Bullish
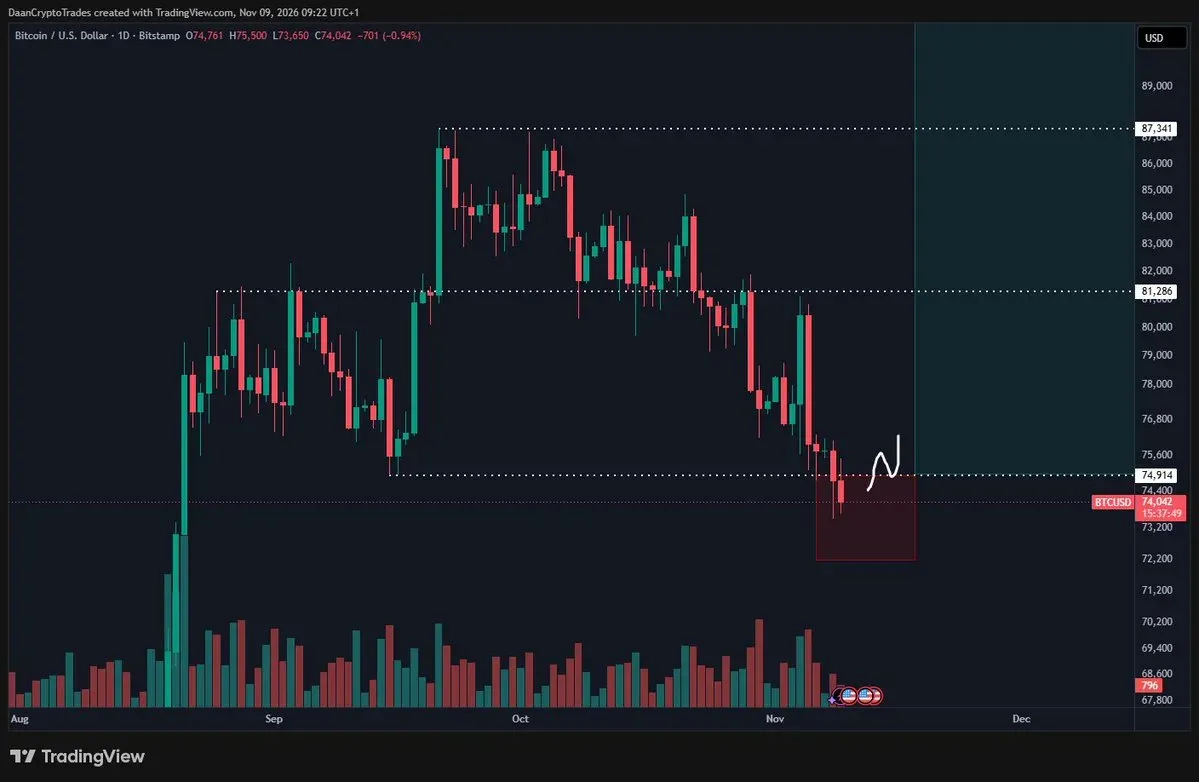
$BTC Semua level terendah dalam rentang ini sudah terlewati.
Sekarang mari lihat apakah para bear akan menurunkan harga lebih jauh setelah break down, atau apakah aksi harga akan stagnan dan kembali ke rentang/level terendah sebelumnya.
Yang terakhir cukup tipikal untuk kebanyakan konsolidasi selama beberapa tahun terakhir (saat tren naik). Dalam kasus ini, kembali ke $75K dan tetap di atasnya akan menandakan bahwa harga siap naik lagi.
 ▼ Bearish
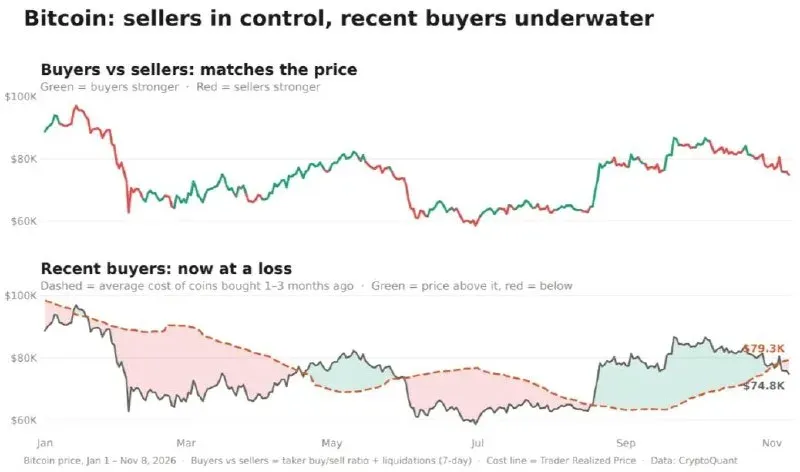
Sellers in Control, Recent Buyers Underwater
“When recent buyers are underwater, some may sell when price comes back to their cost, just to break even. That can make the $79K area harder to break.” – Read More
By Woominkyu | @cryptoquant_official
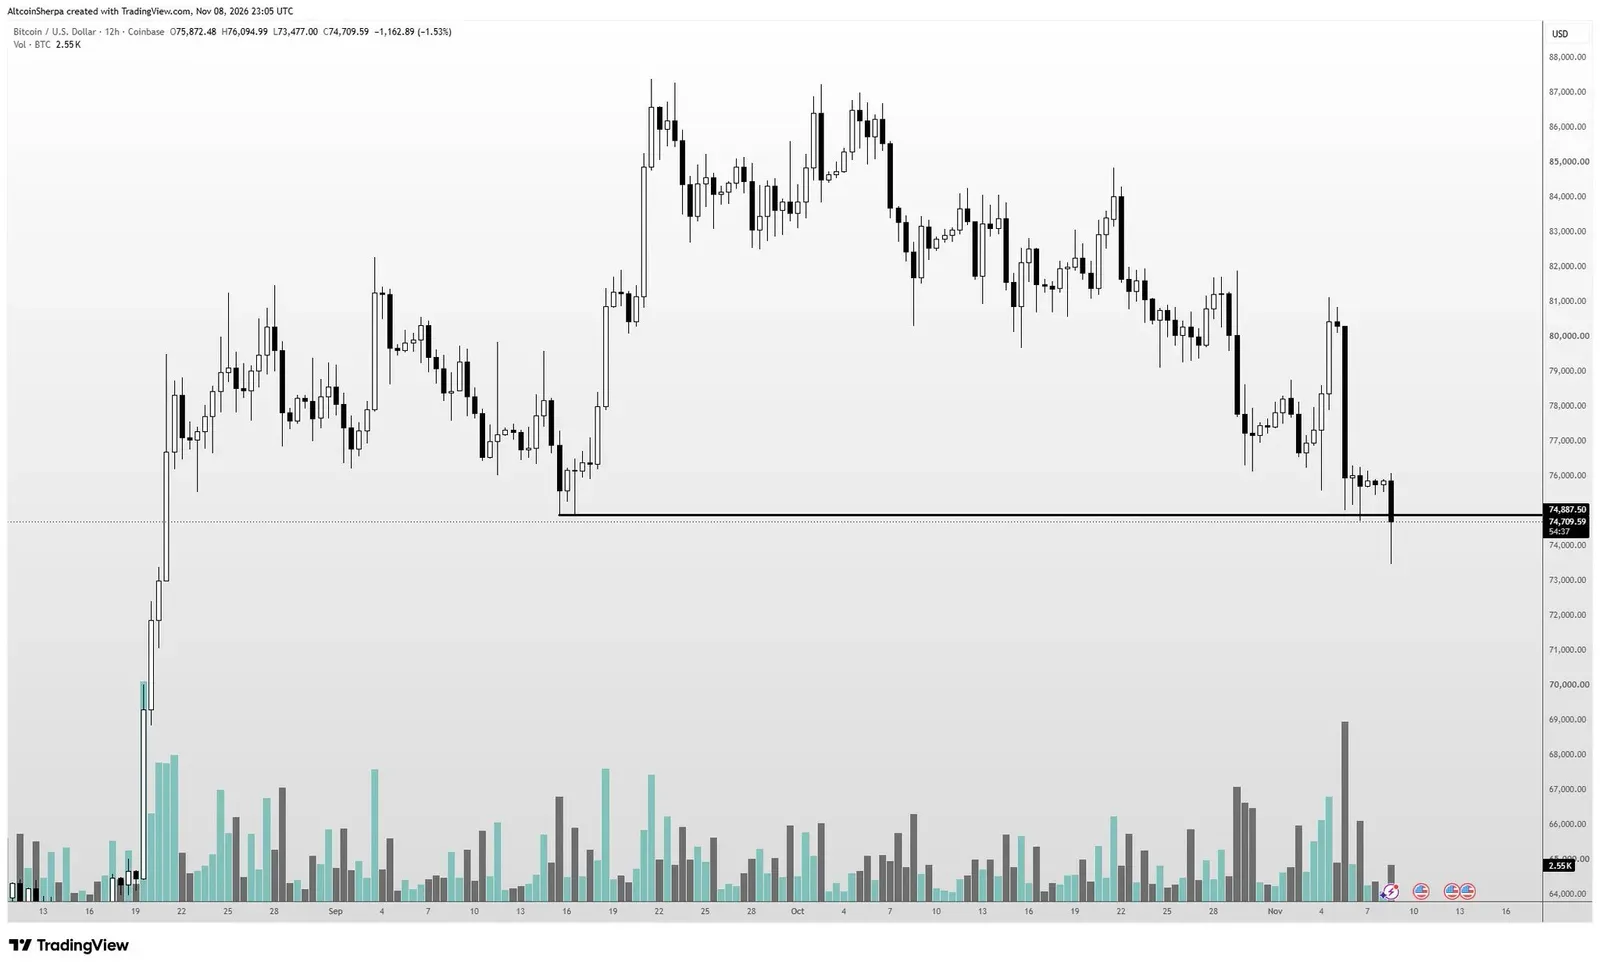
$BTC 74k holding for now but this futures open looks ugly. This is STILL a decent area to bid but I'll admit it's scary af in real time. I am flat any active positions for now
 ▼ Bearish
If #Bitcoin doesn't hold the $75,000 sweep, not much will stop it from dropping sharply.
That's why this is a pivotal area, and that's why it's easy to define risk.
Either it holds here and social media gets sidelined again, or we'll see a massive drop and people will be liquidated.
Standard approach.
▲ BullishThe markets have been relatively garbage over the past four weeks.
However, is that unexpected?
We've just seen a massive run in August/September.
Surely, a move that big over 2 months needs to calm down for at least a month before a new surge comes in.
Markets bottom out when everybody is literally afraid the markets might fall even more.
That's the current stance.
That's why I'm 95% allocated in the markets.
$BTC With how this is shaping up, I am expecting volatility to remain high and for a decision to be made soon.
Locally, $75K & $77K are the levels to watch. I do believe a break of either of those, could accelerate quickly and make for another ~5% move.
There isn't much stopping the move in either direction until that ~$72K-$73K zone and above it would be back to ~$80K.
 ▲ Bullish
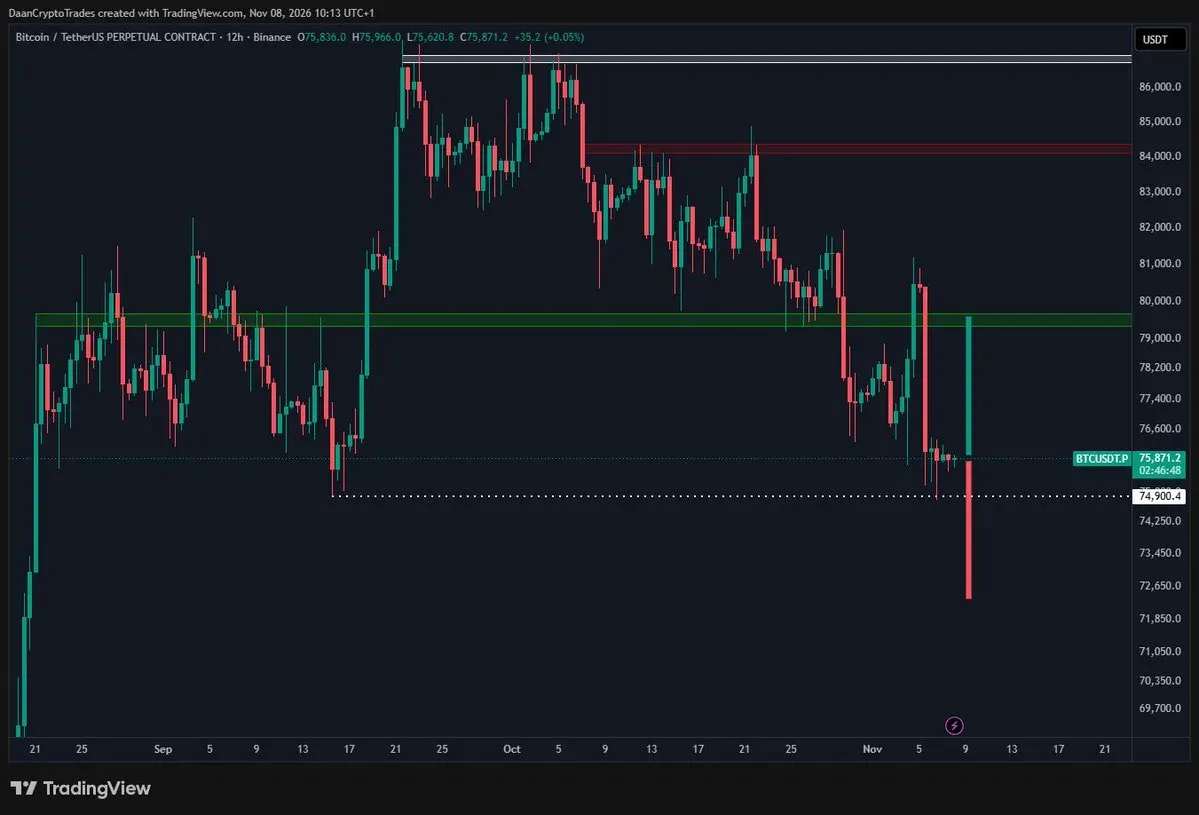
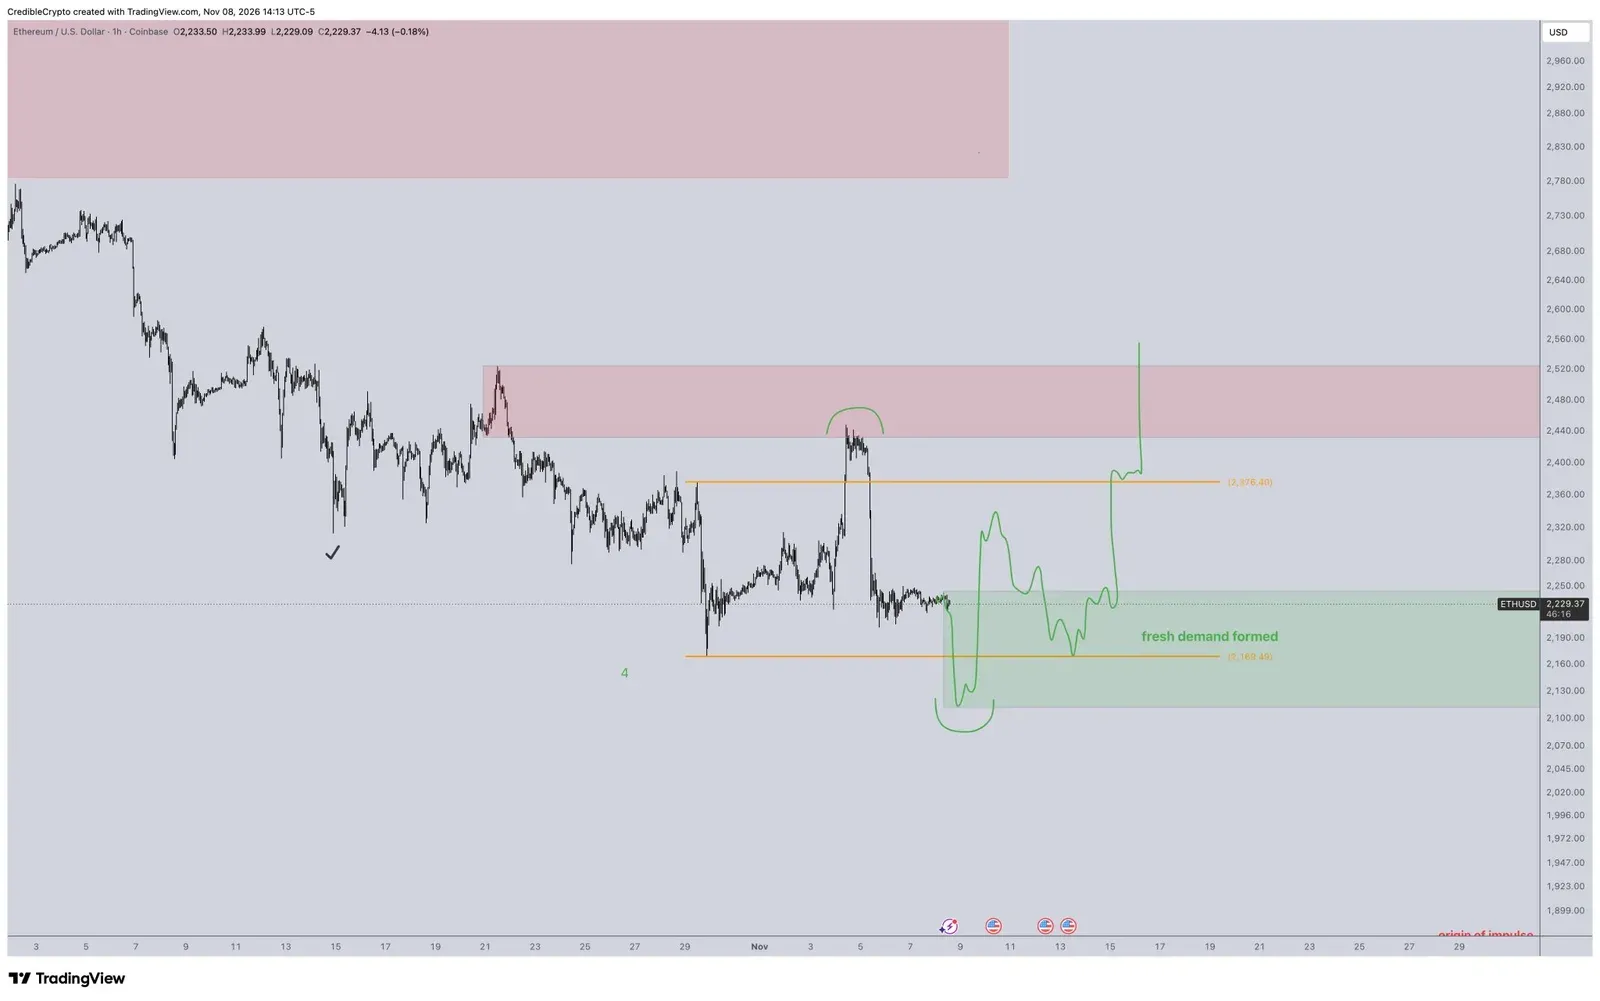
After rejecting at local supply on ethereum:native we now have the local highs of our range swept and the local lows untapped.
I do think we are closer to a big move up vs a big move down across the board, but wound't have an issue with one more lower low here to take our range lows and ideally form a fresh local demand zone from which to base off for the expected rally to the upside.
Either way, LTF PA can take a number of shapes/forms here, my primary expectation is for relief across the board (led by BTC pushing for 90k+) as the next "major" move.
Until we get that just have to be patient here at the lows and not lose your mind by all the doom posting on the timeline.
 ▼ Bearish
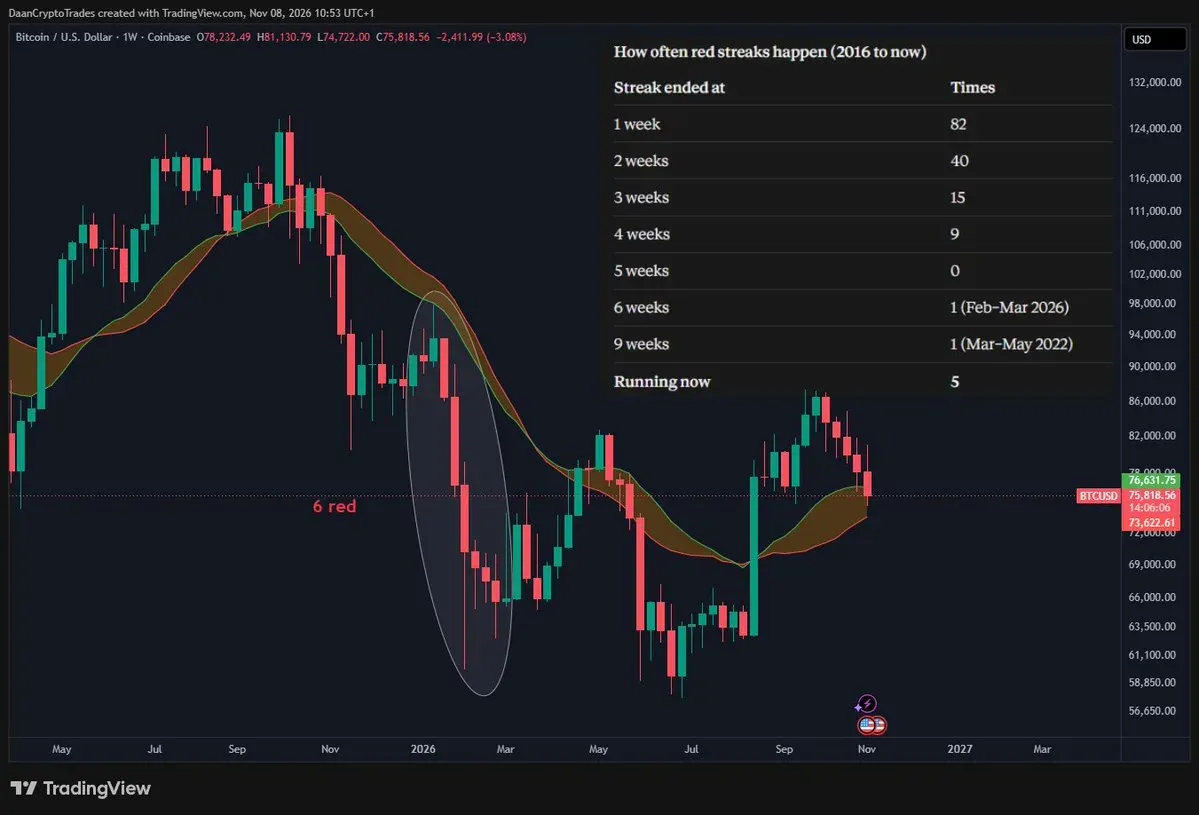
$BTC Is about to close its 5th consecutive weekly candle in the red.
The last time we hit 5+ was this February when it topped at 6.
The only other time before that was all the way in 2022 when we saw 9 consecutive red weekly candles.
So to see 5 in a row is quite a rare sighting. The other two streaks happened in middle of a bear market and when price traded below the bull market support band in a bearish structure.
Next week is going to be interesting as I suspect we will get a resolution on this either way. Eyes on the weekly closes.
 ▲ Bullish
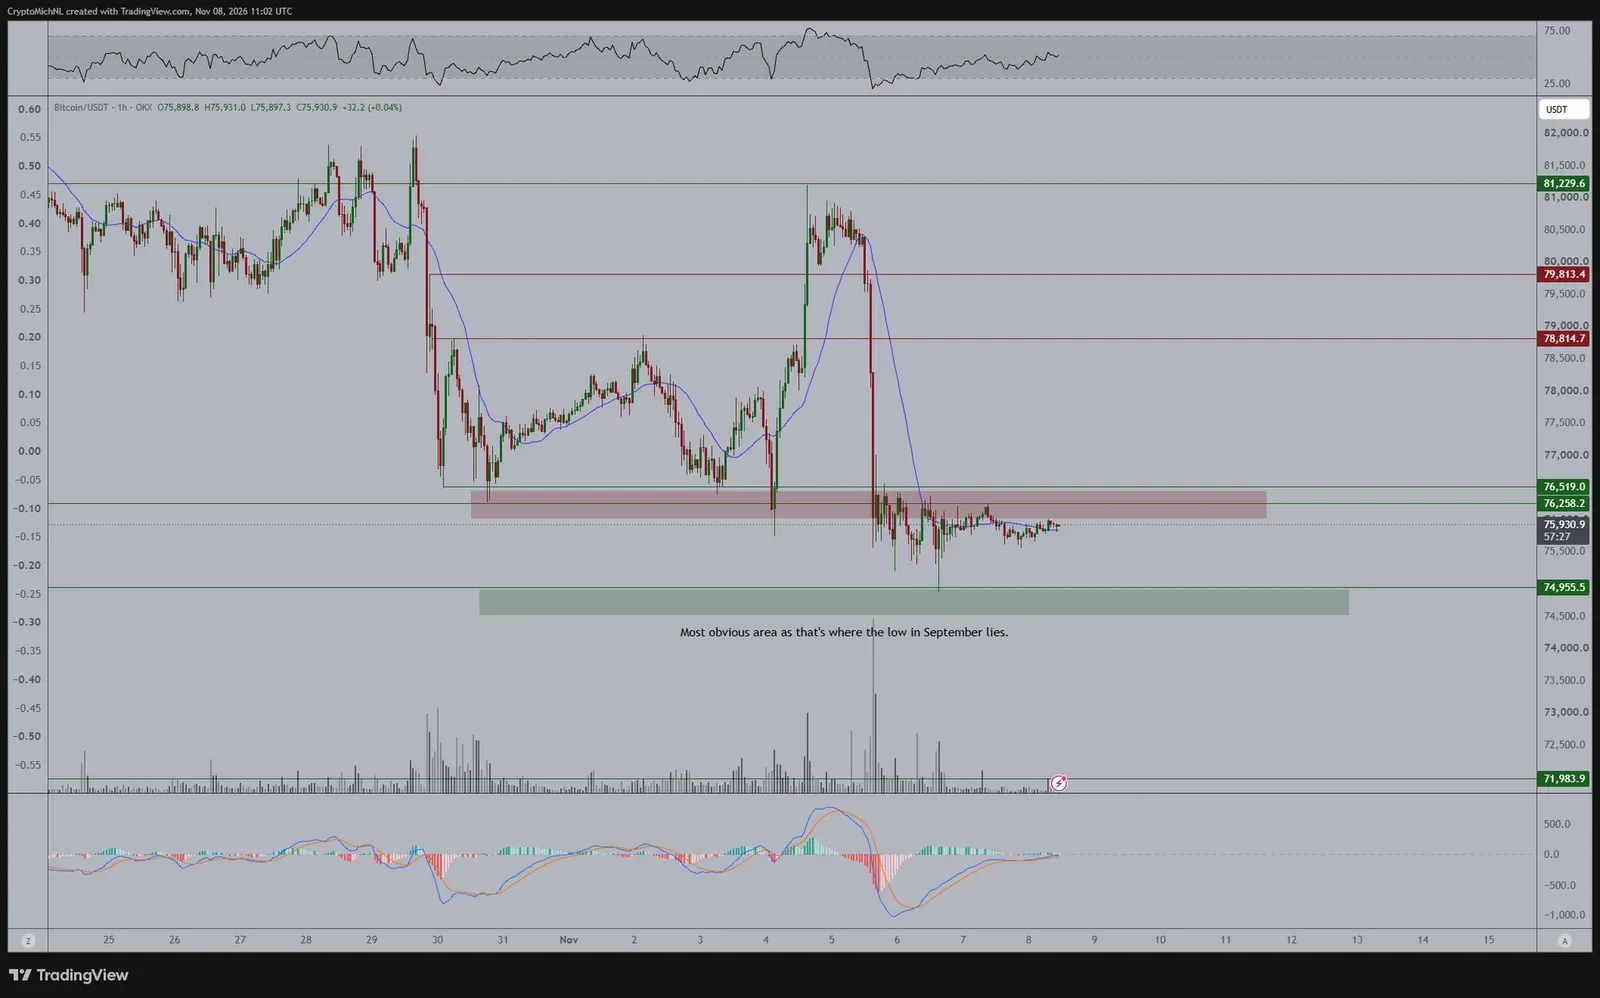
Literally nothing has happened for #Bitcoin over the weekend.
That was quite to be expected, unfortunately.
Technically, Bitcoin has swept the lows, meaning we're likely to break higher.
However, if it wants to break upwards, we'd need to break through $76,000 in order to get that momentum going.
If that happens early in the coming week, things can move fast as there are no levels in between.
 ▲ Bullish
Tbh does feel like sentiment is the absolute gutter right now across the board lol.
Looking forward to 90k+ $BTC :)
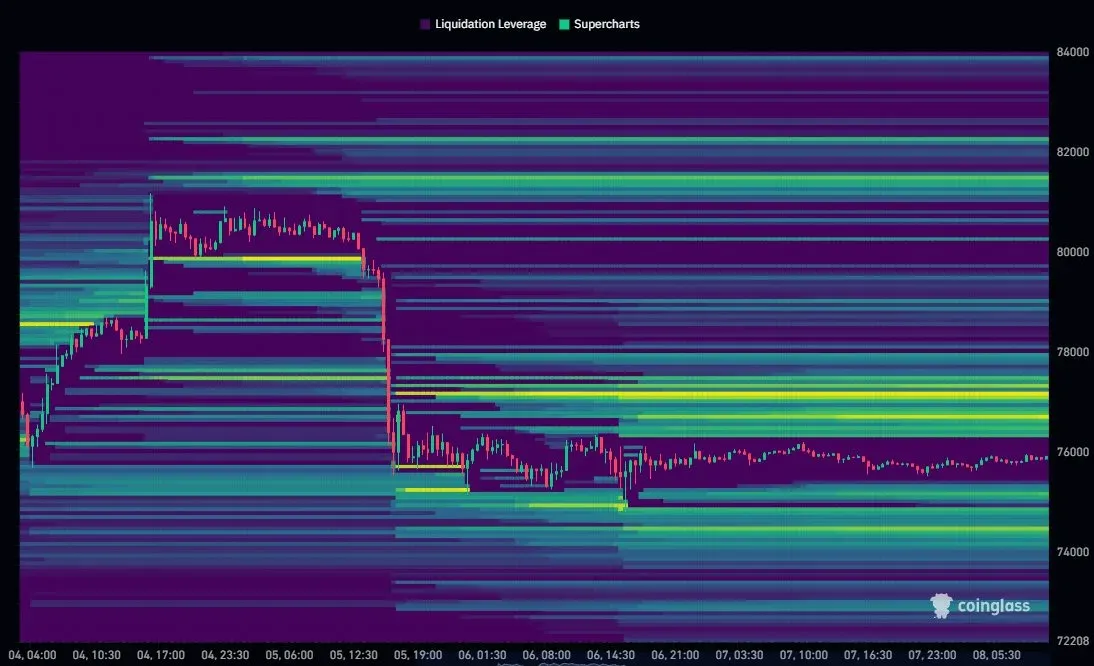
$BTC After the volatile mid-week, price has been sideways for the past two days.
This makes it so there's a lot of positions that have built up on both sides.
Decent chance there will be a liquidity grab for both sides at some point.
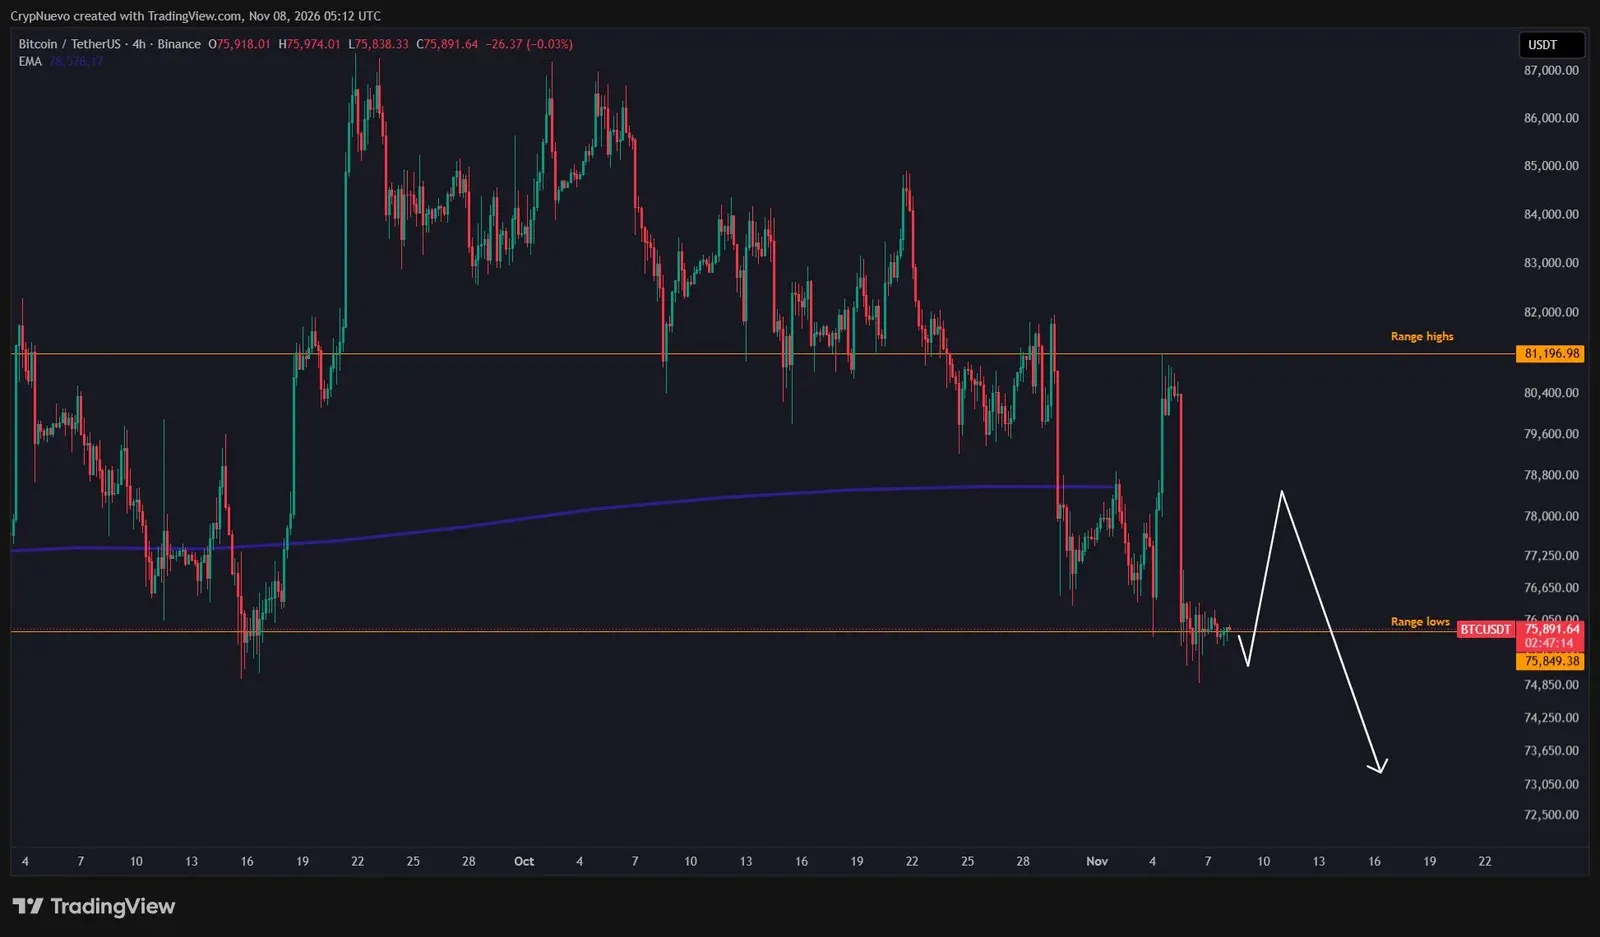
$BTC Sunday update:
This is my analysis for this week.
It'll be an interesting week ahead with inflation data (CPI, PPI) and some metrics like a liquidation cluster, Open Interest and a long wick.
Let me walk you through it in more detail:
🧵↓(1/6)
 ▲ Bullish
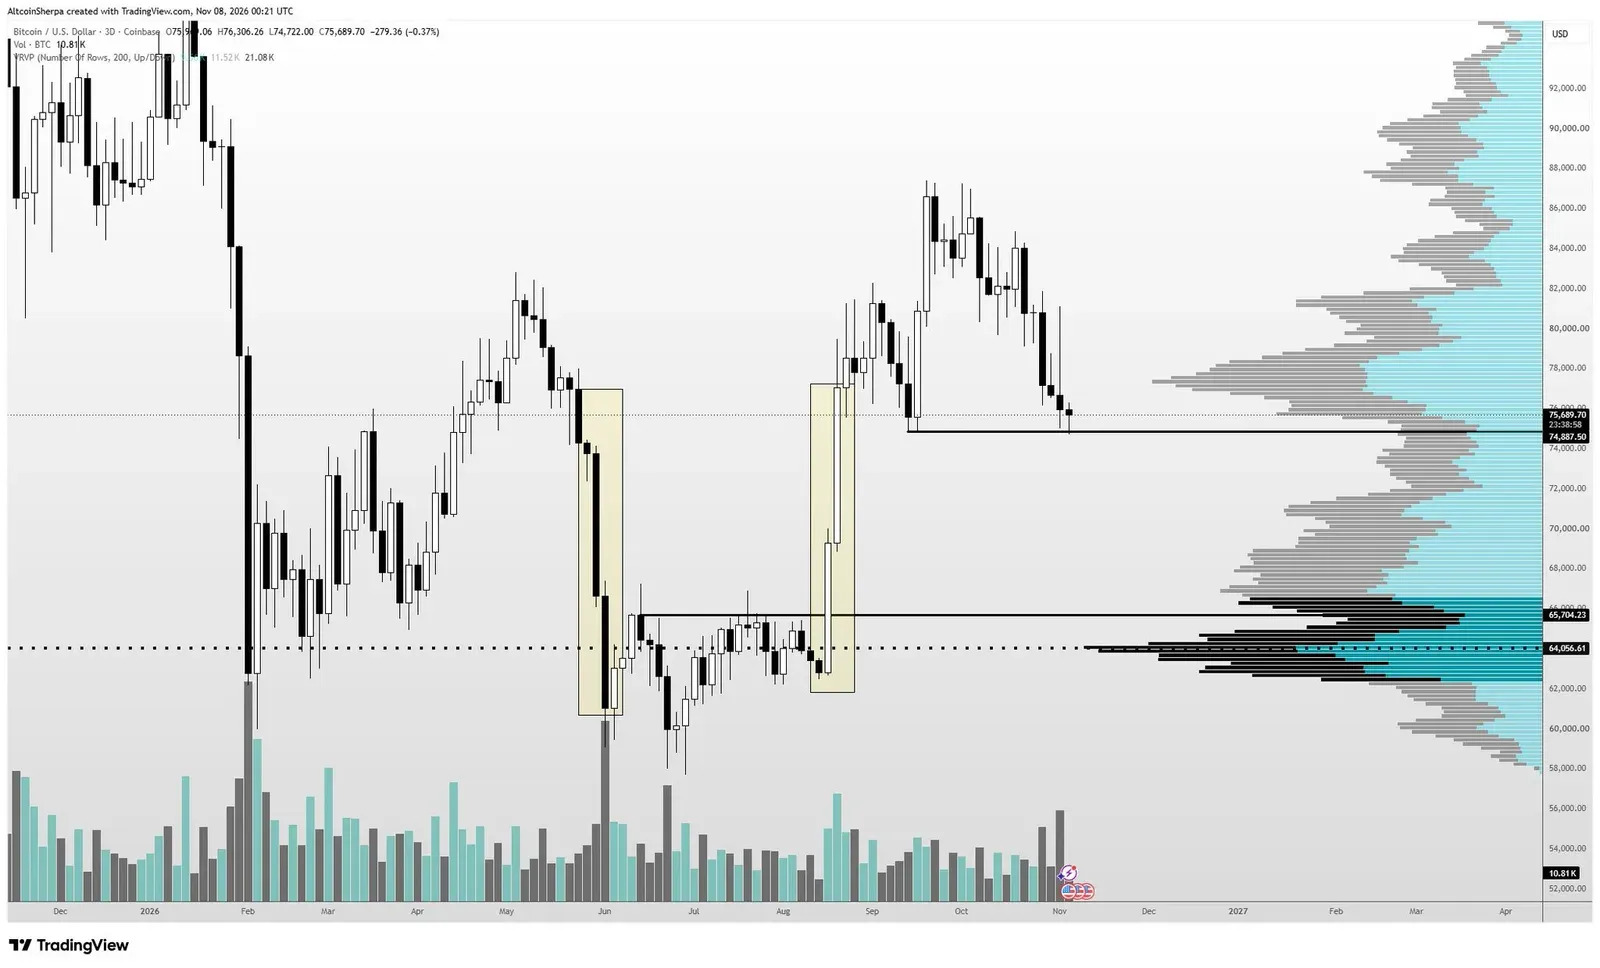
A few notes on the $BTC chart:
-If price loses 75k, I don't really see many strong levels until the 65ks. I expect there to be a bounce before then but the levels aren't super clean to me.
-Zooming out even further, it seems as if we're just in 1 gigantic trading range for nearly all of 2026. The range highs just got tapped.
-I don't expect us to go to the range lows unless macro gets really really awful. That's reaching 60k again
-Price may want to fill out the 2 illiquid moves in the yellow boxes. When price blitzes up or down, usually you'll see price slowly creep up (or down) and fill that void; it's almost like a CME gap. If this happens then we're in for a multiweek chop in the 66k-74k area.
-All in all, I still believe we are in for a multi week chop event regardless. This could certainly be a local bottom and it's still a decent support region that has held multiple times over the past few weeks. Support is still support until shown otherwise.
-Expecting altcoins to conti
 ▼ Bearish
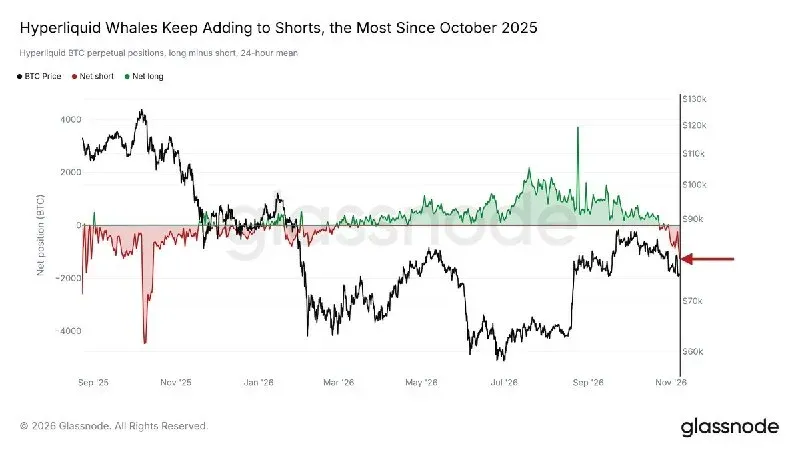
Hyperliquid whales are adding to their $BTC shorts.
Their net positioning turned short 2 weeks ago after 7 months of being long. Short exposure is now the largest since October 2025.
The last time they were this short, price moved down considerably.