Daan Crypto TradesTrader
▲ TăngÍt nhất $BTC vẫn an toàn trước các đợt bán tháo do scandal.


Ít nhất $BTC vẫn an toàn trước các đợt bán tháo do scandal.
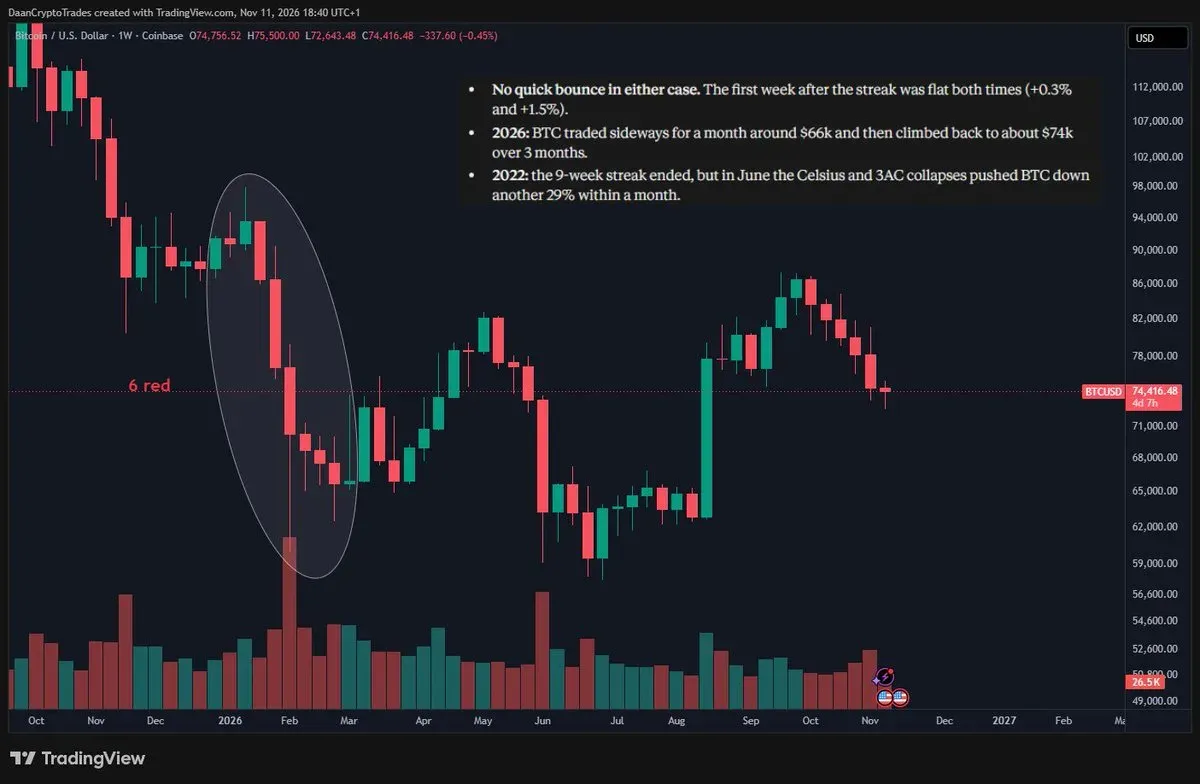
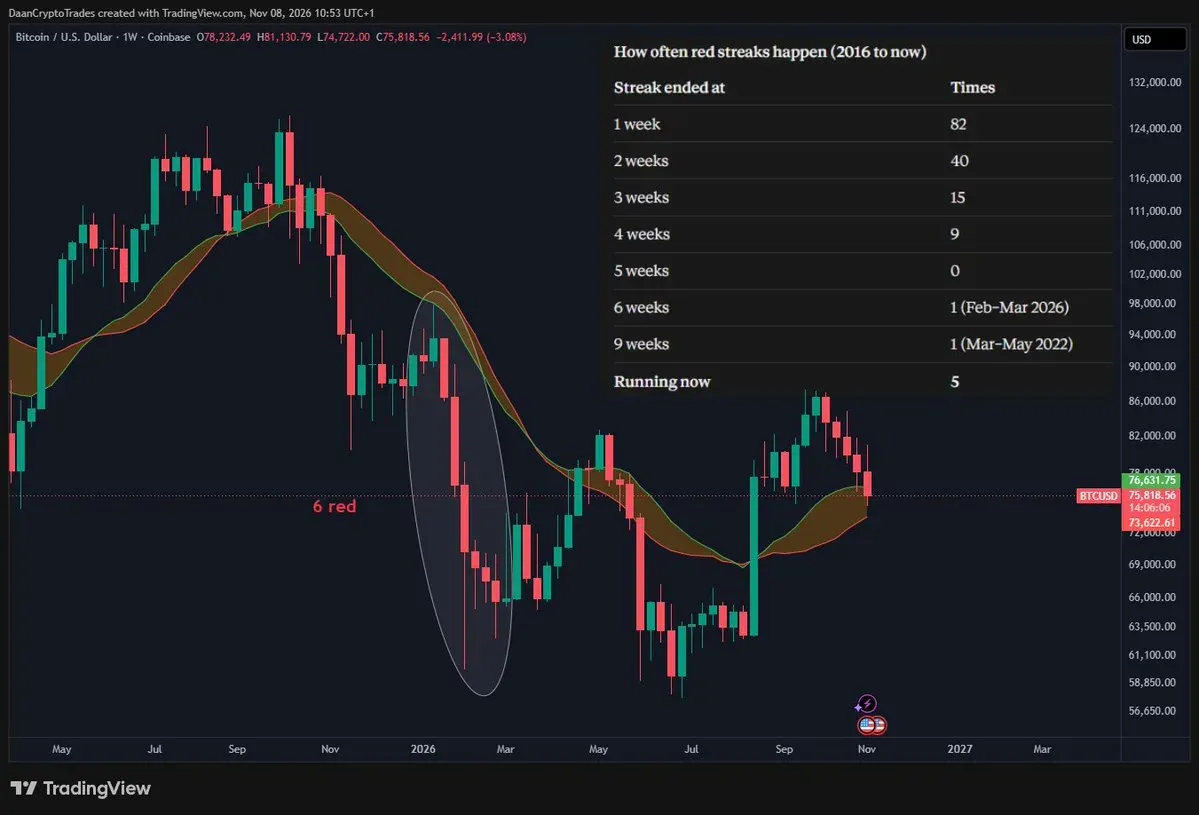
$BTC Đã kết thúc 5 nến tuần đỏ liên tiếp. Đây chỉ là lần thứ 3 trong thập kỷ qua xảy ra như vậy. Nến hiện tại khá phẳng nên chúng ta sẽ phải xem nó đóng như thế nào. Hai lần còn lại chúng ta thấy 5+ là vào đầu năm nay năm 2026 và một lần vào năm 2022 khi chúng ta thấy 9 tuần đỏ liên tiếp. Cả hai trường hợp đều cho kết quả rất khác nhau sau khi chuỗi kết thúc, mẫu quá nhỏ để có thống kê có ý nghĩa.
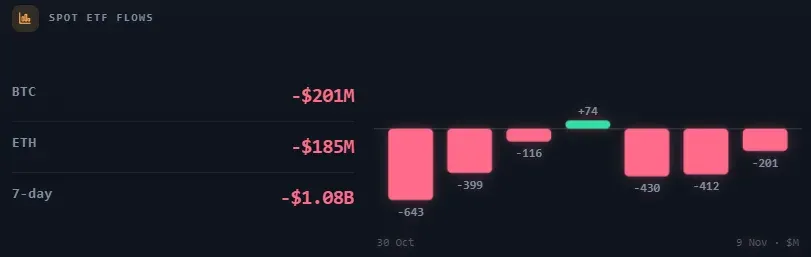
$BTC and $ETH are on a massive ETF outflow streak. BTC has seen -$2B in outflows in the past 7 trading days alone. ETH has also lost about -$1B the past 2 weeks. Big outflows at local highs/lows can be a sign of absorption or a local reversal area but only if you actually see price stall. As long as price keeps bleeding as the outflows keep going that just means the selling is adding onto the downside momentum. When price stalls and outflows keep going, that's when you should be watching closely.
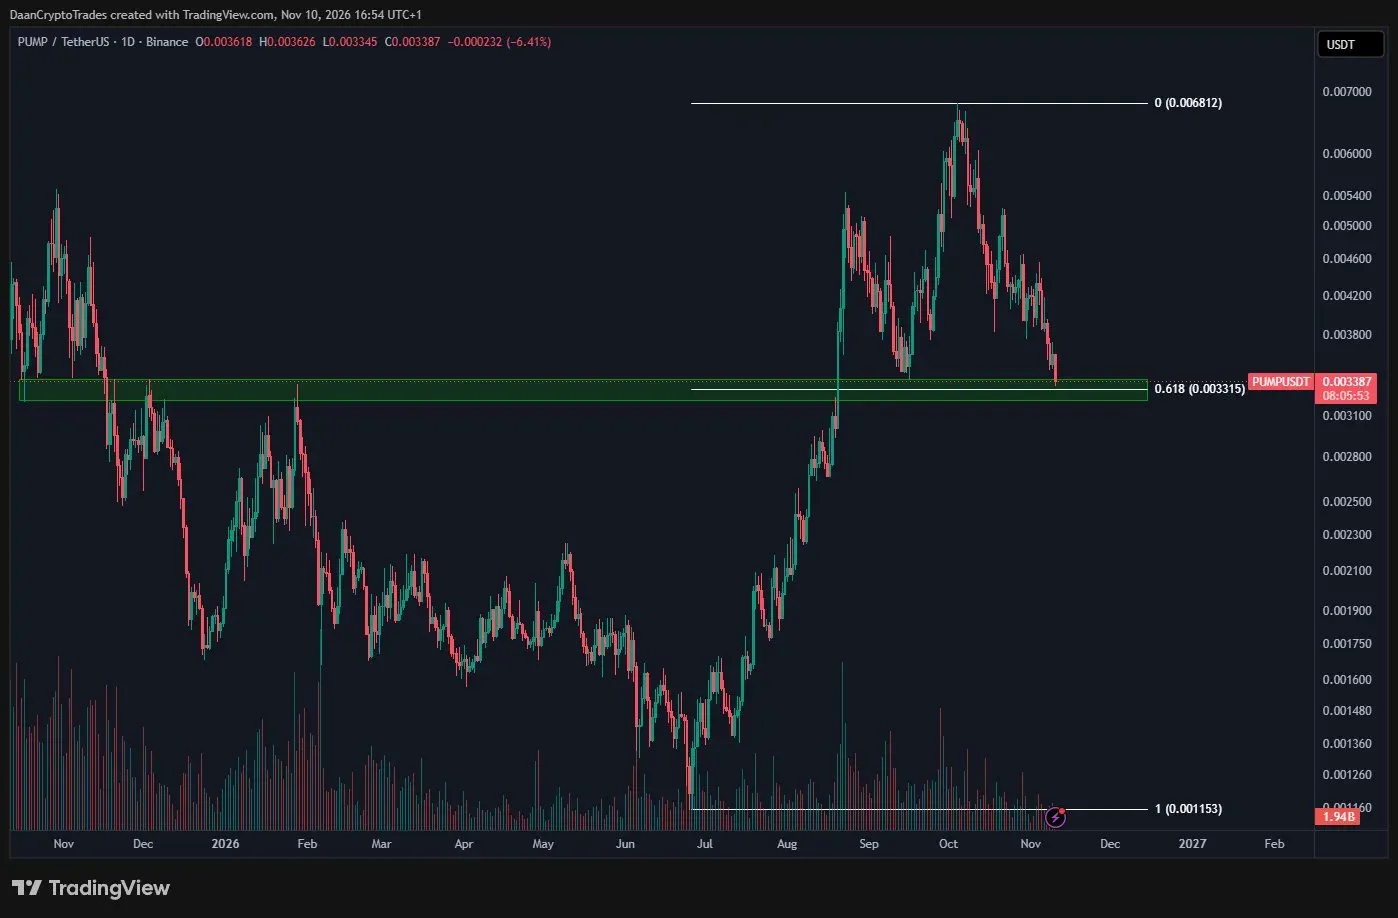
$PUMP Same level. First proper high timeframe support in a while. PUMP now down -50% from the recent highs. This current level has acted as support & resistance before and is pretty key to what happens here in the short term.
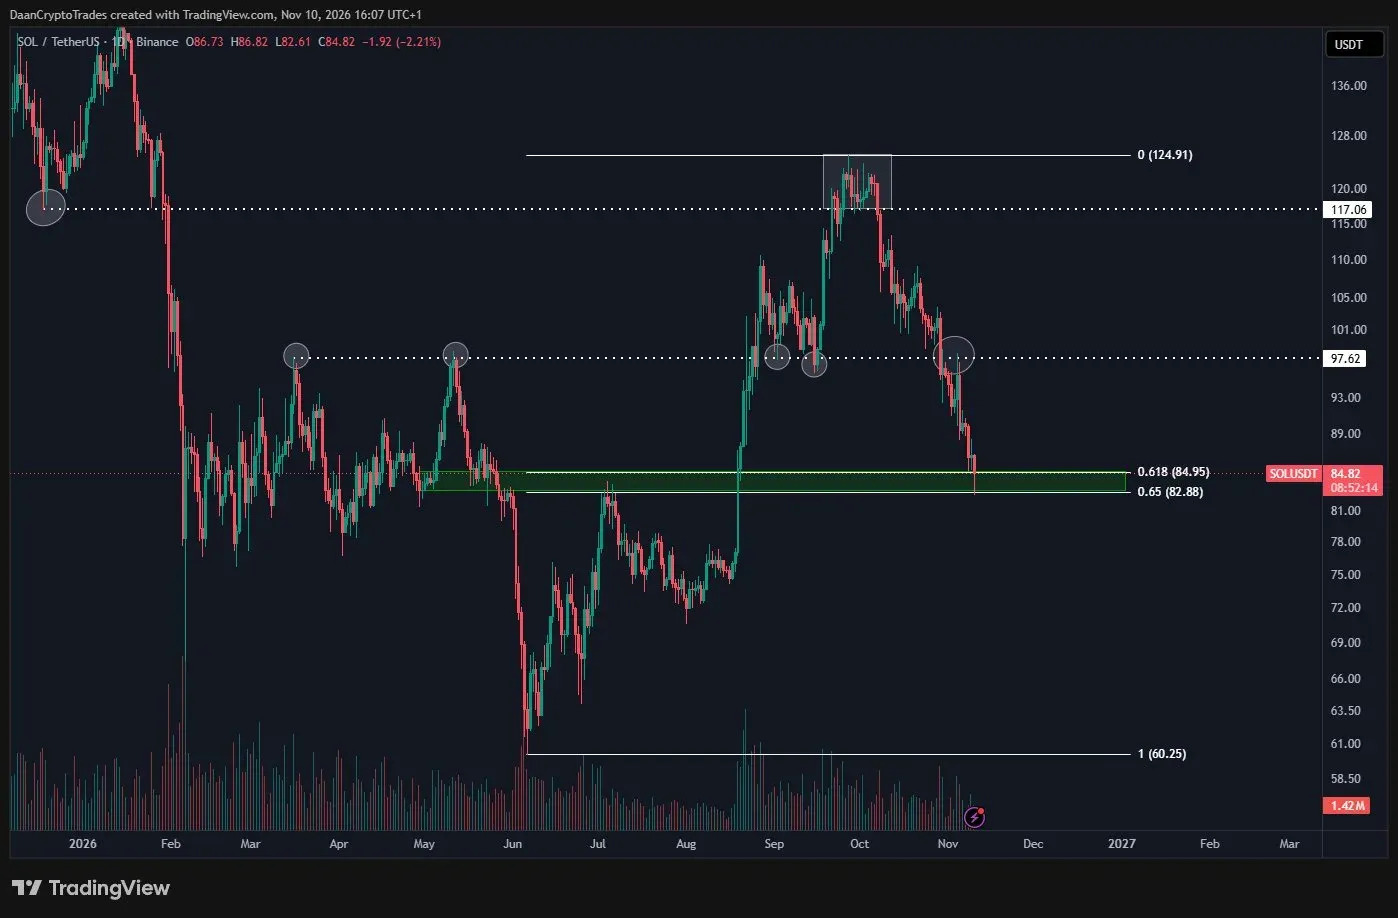
$SOL Has been incredibly weak for the past few months. Underperforming $BTC & $ETH by a good margin. But we've finally arrived at a decent high timeframe support level. I am very curious to see the reaction around this point. On the downside, $82 should hold for the bulls. If we see a bounce or squeeze then that $98 horizontal which turned into resistance would be up. This sold off -33% in 45 days without any proper bounce or short covering. So I do think once that gets started we can see a decent bounce. Just needs to hold this area first or mid $70s would be next.
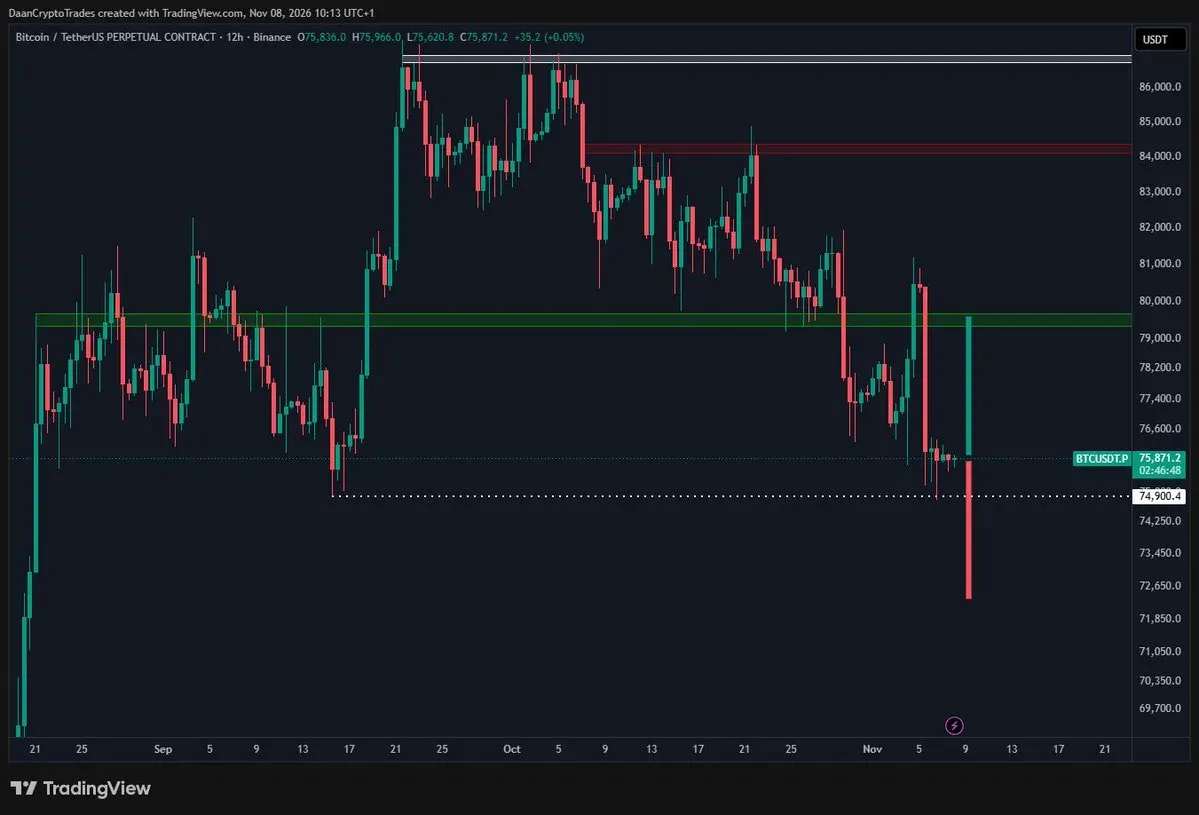
$BTC Didn't even see that many long liquidations. But Open Interest is exploding after this CPI report, lots of shorts piling in on this weakness post CPI. We saw the same thing last month. Back then, the shorts didn't immediately get squeezed until some days later.

$BTC Here we are, right in the middle of the big $72K-$75K area. This is where a lot of high timeframe levels come together. This is what makes it an interesting zone for a potential higher low to be created after the initial move up. This has been my downside level to watch. I wish I was patient enough to actually wait for this area all this time, would have saved some unecessary trades. Anyways, here we are, eyes on the weekly and daily closes. If you believe we have started a new bull market after that $58K-$87K rally then this is the area to watch.

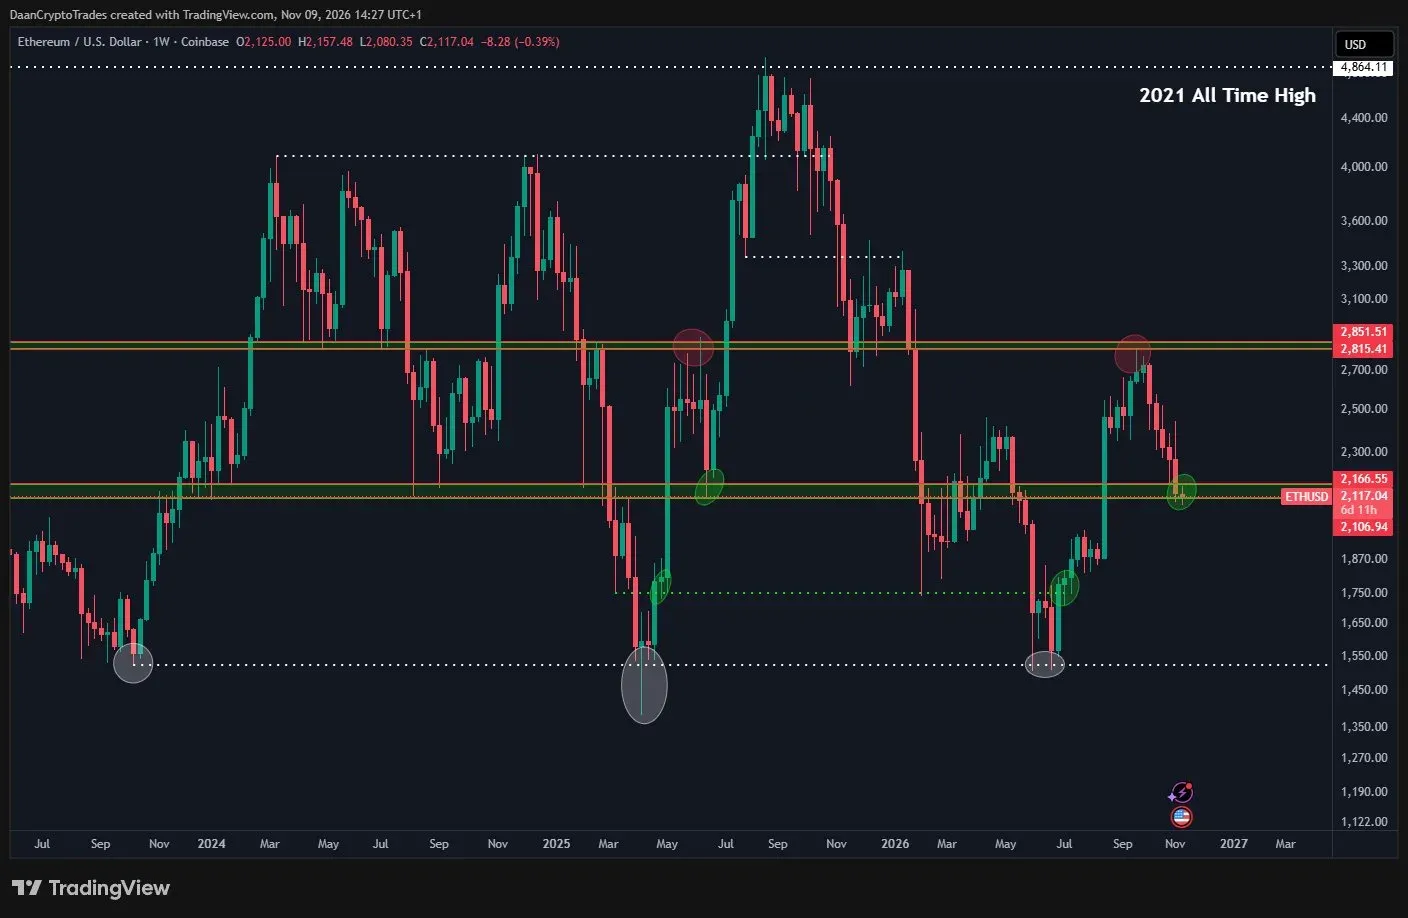
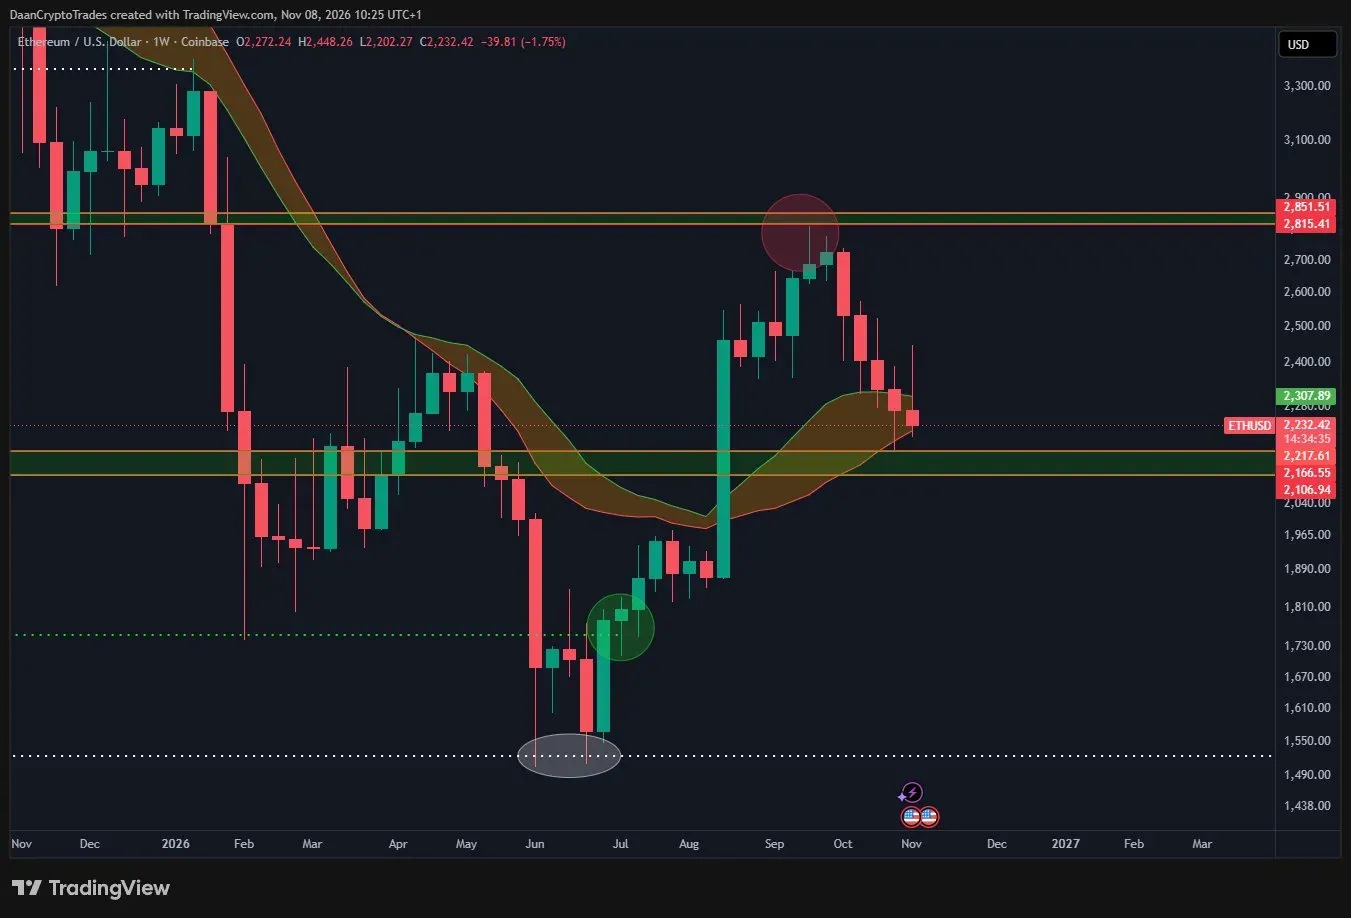
$ETH Repeating the 2025 playbook so far. - Bottom around $1500 - Retake $1750 and accelerate from there - Fail the $2800 retest - Rejection back down to $2100 - Bounce?
$BTC All the lows in this range have been swept. Now let's see if the bears push this further down after the break down, or if price action stalls and retakes the previous range/lows. The latter would be pretty typical for how most of these consolidations turn out over the past years (during up trends). In that case a retake of $75K and holding above would signal that this is ready to move back up.
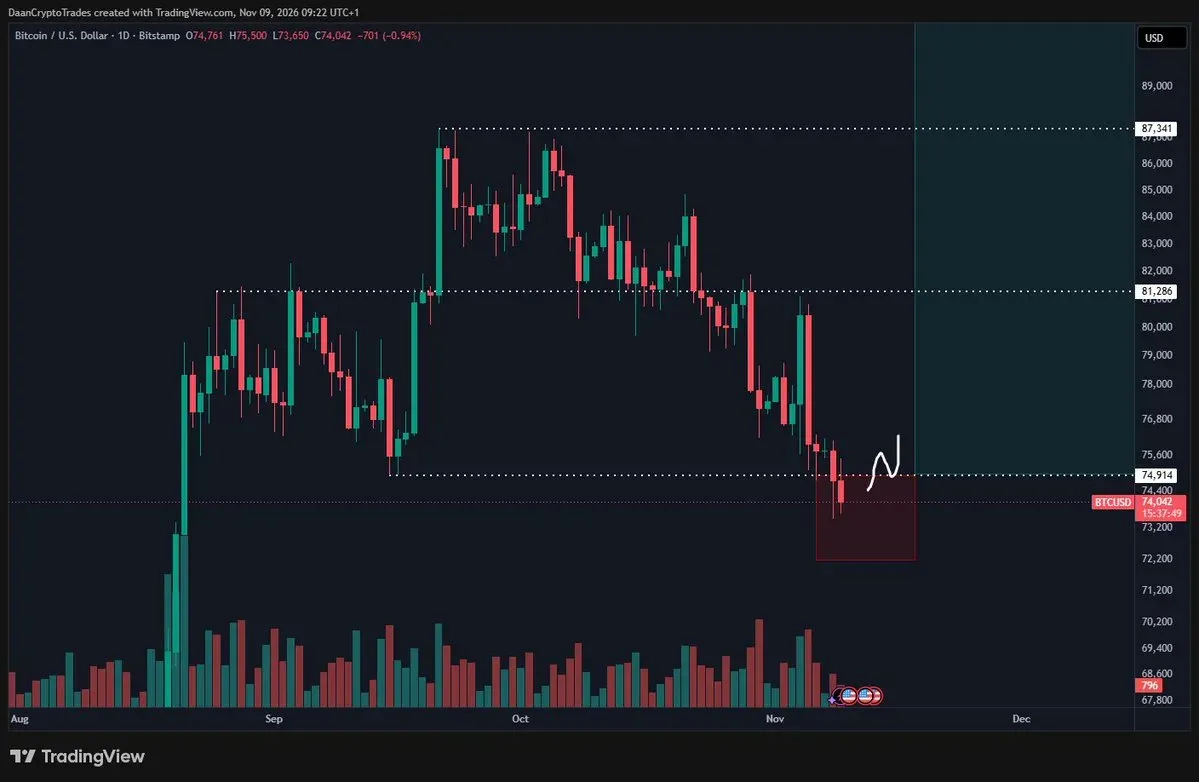
$BTC With how this is shaping up, I am expecting volatility to remain high and for a decision to be made soon. Locally, $75K & $77K are the levels to watch. I do believe a break of either of those, could accelerate quickly and make for another ~5% move. There isn't much stopping the move in either direction until that ~$72K-$73K zone and above it would be back to ~$80K.
$ETH Sitting right at its bull market support band. These past few candles have been trying to hold on to the retest. ETH first broke below the bull market support band back in October 2025, after which it rejected on all its tests. August was when ETH finally broke above in violent fashion, now the bulls need to hold on to it as support to create a higher low. Eyes on the closes.
$BTC Is about to close its 5th consecutive weekly candle in the red. The last time we hit 5+ was this February when it topped at 6. The only other time before that was all the way in 2022 when we saw 9 consecutive red weekly candles. So to see 5 in a row is quite a rare sighting. The other two streaks happened in middle of a bear market and when price traded below the bull market support band in a bearish structure. Next week is going to be interesting as I suspect we will get a resolution on this either way. Eyes on the weekly closes.
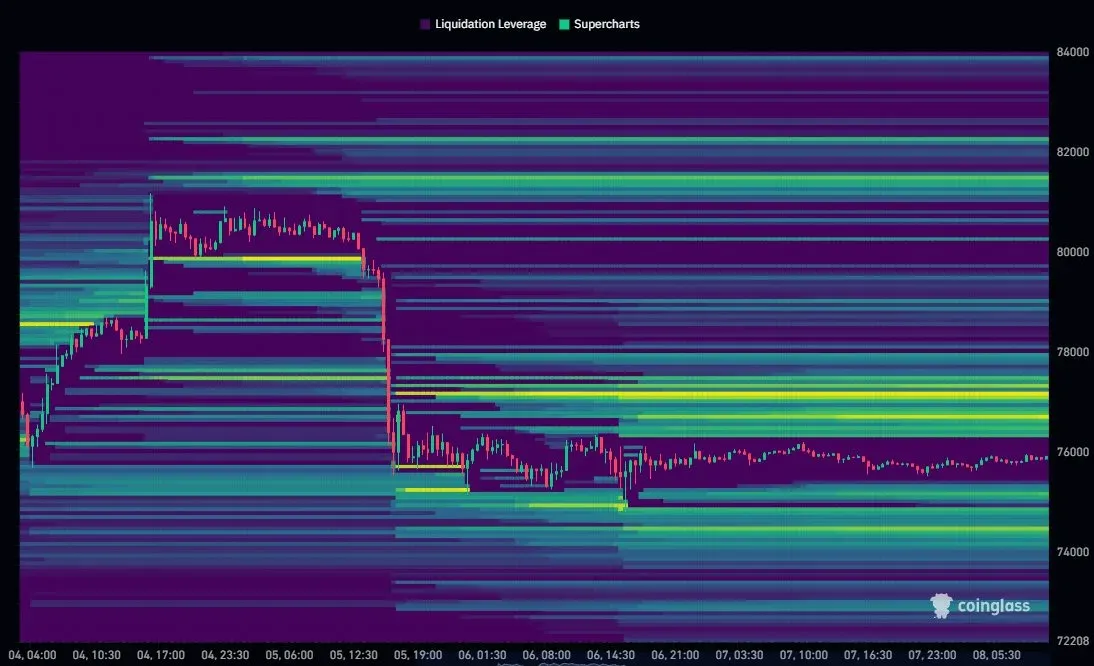
$BTC After the volatile mid-week, price has been sideways for the past two days. This makes it so there's a lot of positions that have built up on both sides. Decent chance there will be a liquidity grab for both sides at some point.
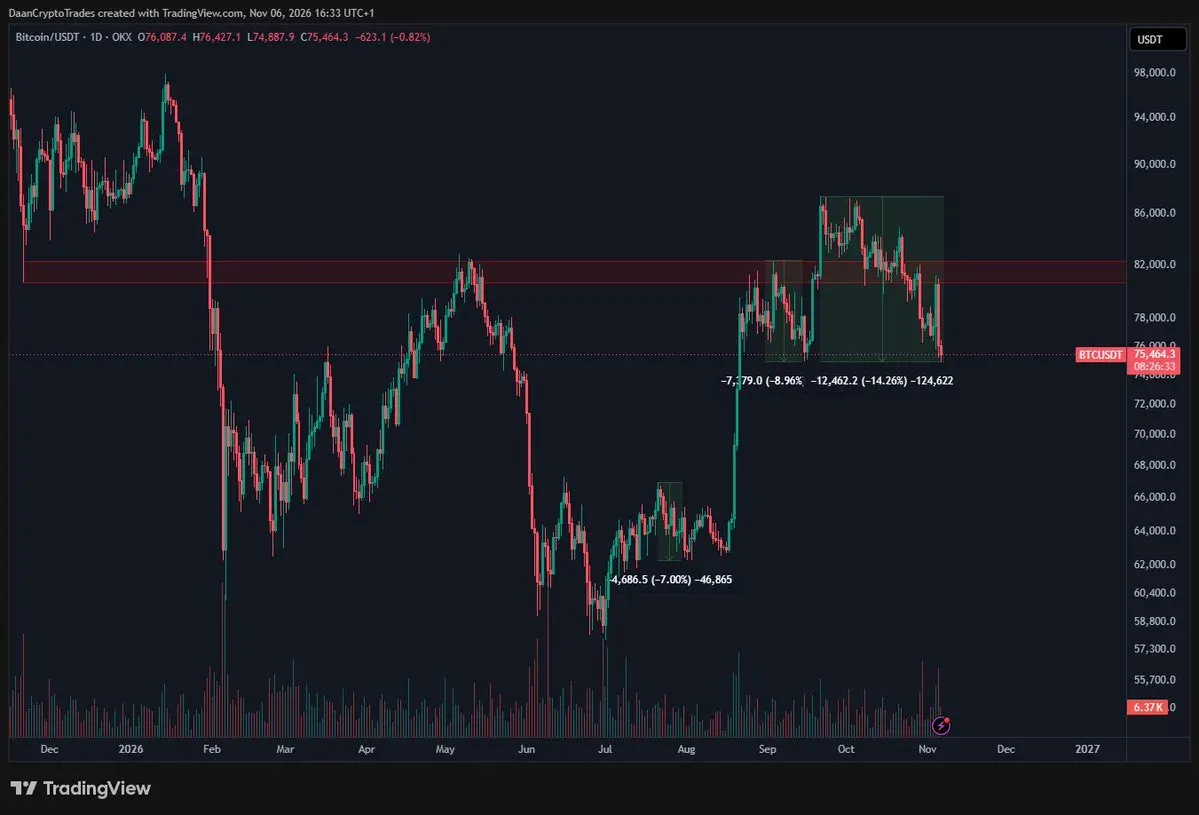
$BTC Holding on to the $75.5K support after that massive flush which swept the September low. Above, that $81K level has been important. Main level for the bulls to break to get the momentum back.
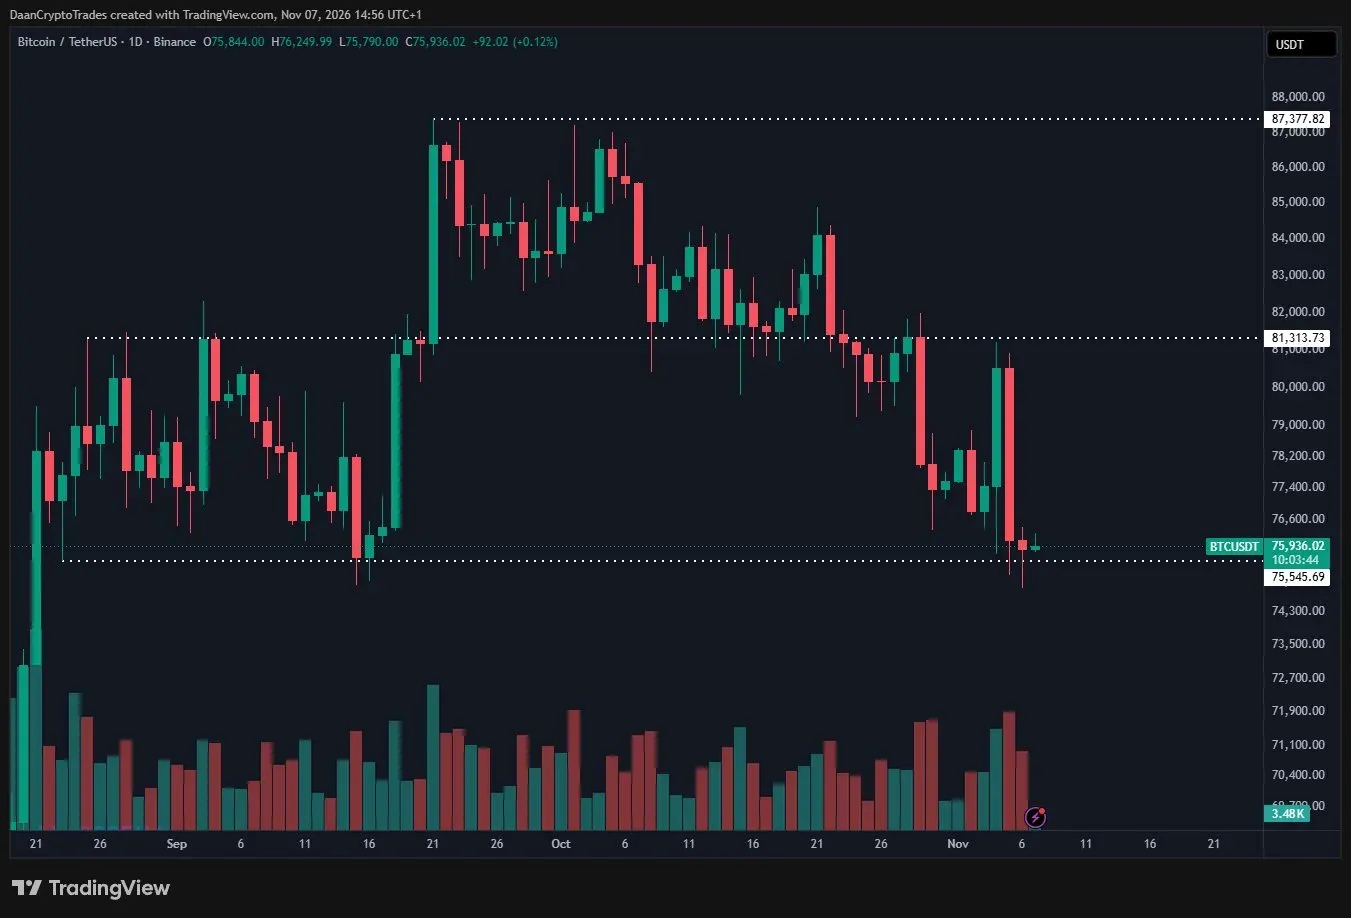
$BTC Now with its largest drawdown since the $58K to $87K rally. I don't have to tell you that corrections like these are normal for Bitcoin. Volatility in general has actually already been much lower than prior years. But for the high timeframe structure to have some proper bullish momentum again, you'd need to see a break back above $80K. Below this $73K-$76K zone is the big high timeframe support region to watch.