
Heatmap
How to read the tiles: size by market cap, color by price change, the 24h and 7d switch.
Cette rubrique n'est pas encore traduite dans votre langue ; elle s'affiche donc en anglais.
The heatmap shows the 50 largest cryptocurrencies at once. In a second you see whether everything is up, everything is down or only part of the market is moving.
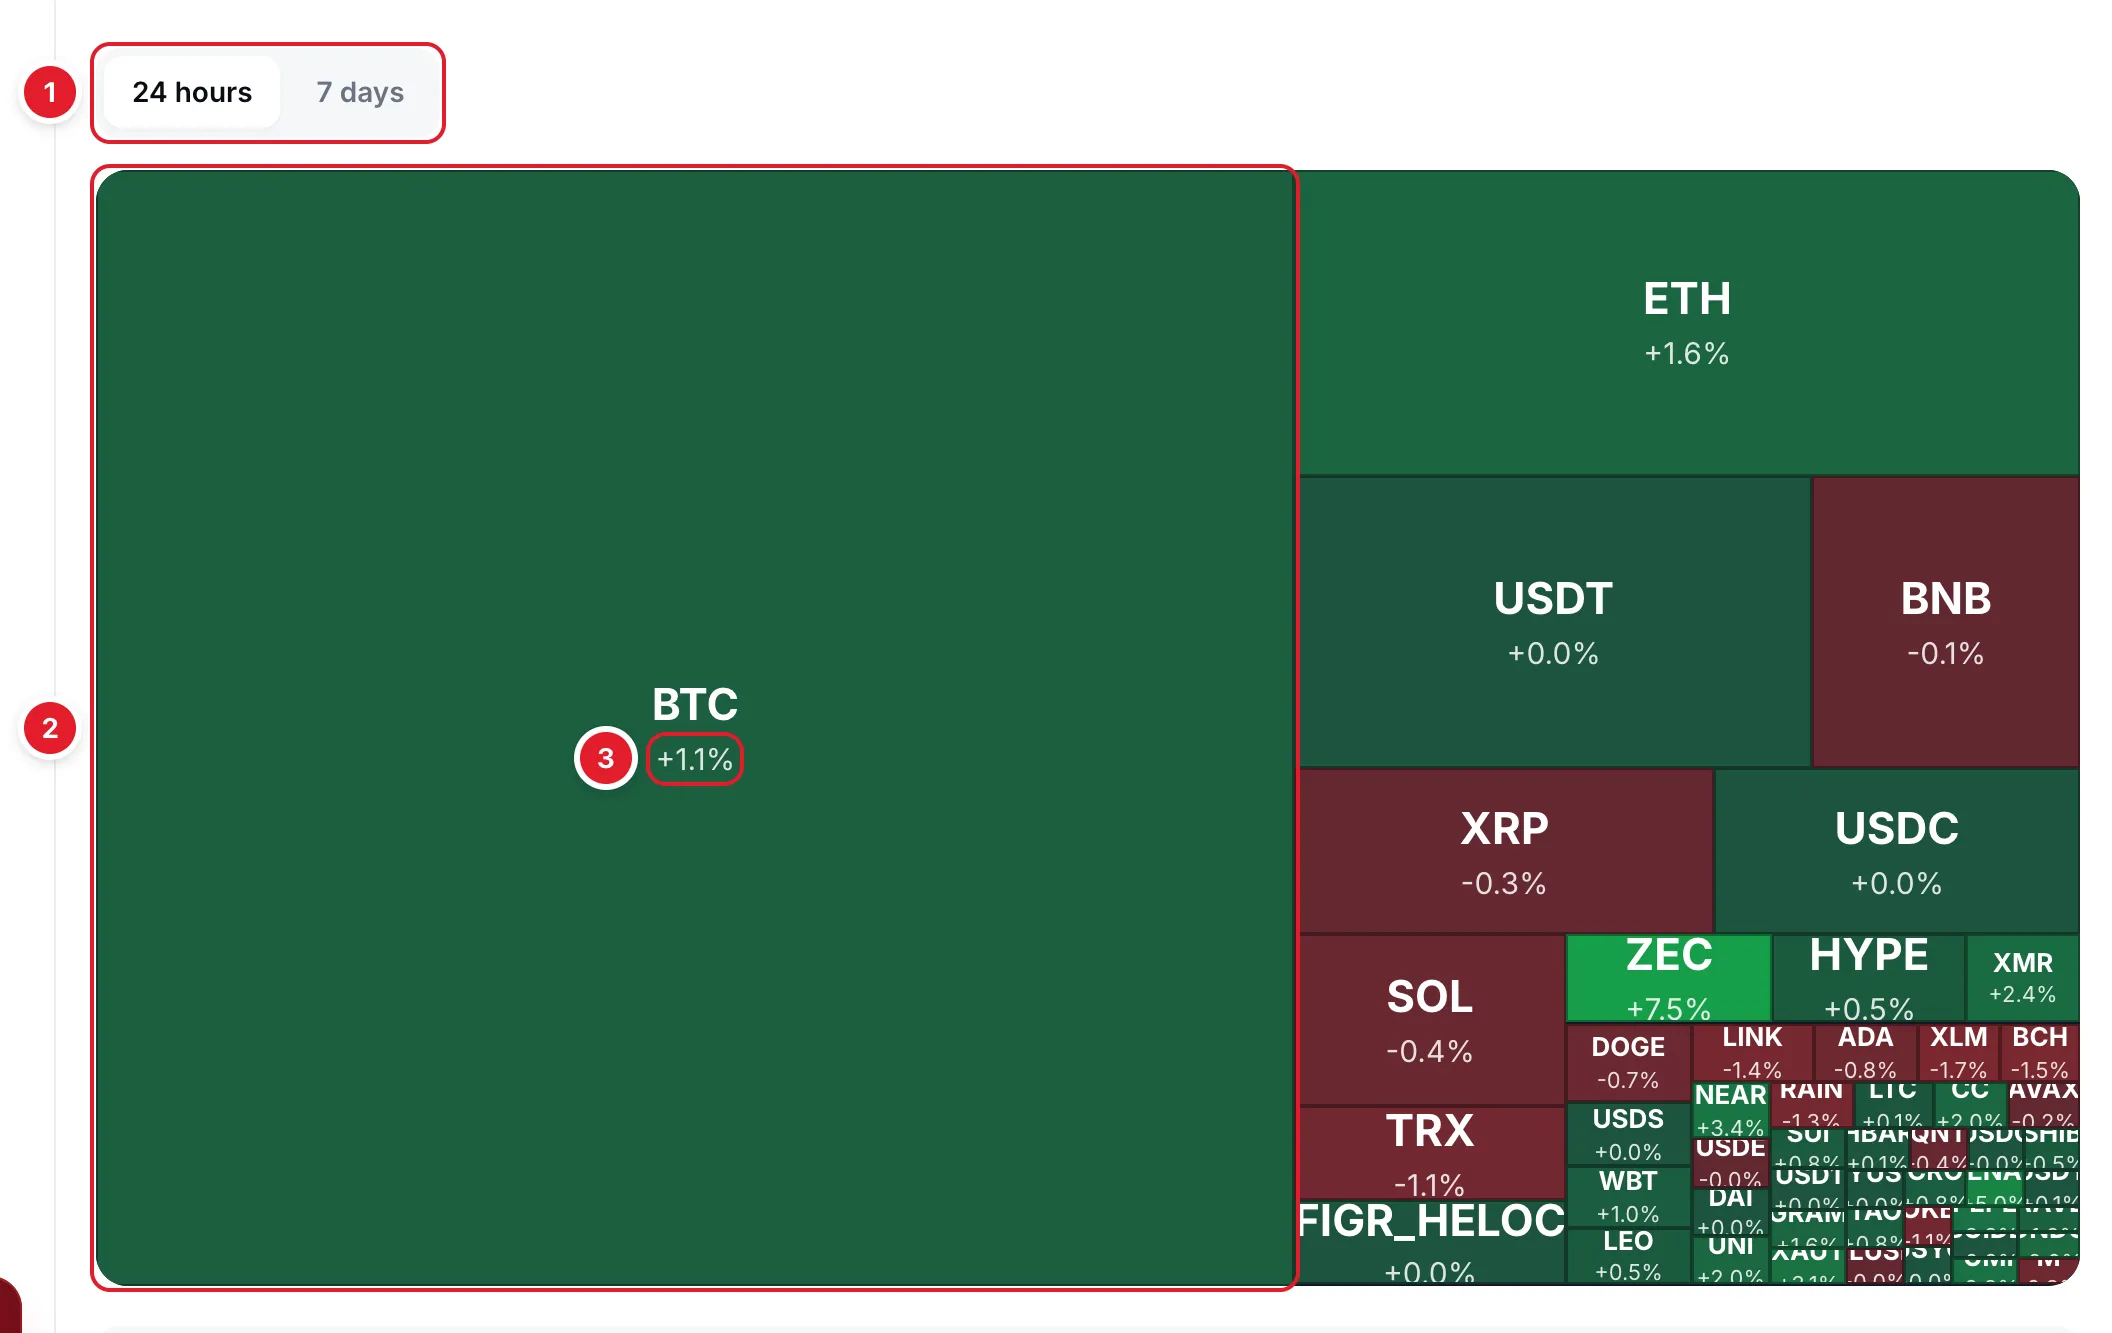
- 24 hours / 7 daysThe period for the price change. Tile sizes stay; only the colors change.
- TileOne coin. The bigger the tile, the bigger the market cap: bitcoin is always the largest. Click a tile to open the coin's page.
- Price changeThe percentage over the chosen period. Small tiles may hide it: hover for the name and the change.
How it is calculated
A tile's area is proportional to the coin's market cap: twice the cap, twice the area. Tiles are laid out with a squarified treemap so they stay close to square and easy to read.
tile area = coin market cap ÷ market cap of all 50 coins × map area
Color: green when up, red when down. The bigger the move, the stronger the color; at ±8% and beyond it is at full strength.
CoinGecko prices; the map refreshes every two minutes. Stablecoins are in the top 50 too and almost always look gray: their price stays near $1.